 The Trading Experiment:
Today’s lesson is going to fast-track your trading success if you actually follow-through with the interesting trading experiment I have designed for you.
This is a potentially life-changing experiment that will very quickly (in under one month) teach you many valuable trading lessons which will open areas of your mind that you may have not yet activated.
What you are going to do is trade every price action signal that you see for an entire month. The rules and conditions of the experiment will follow, but essentially you are going to take any pin bar, fakey setup or inside bar pattern that you see on the daily or 4-hour chart of the major markets we normally discuss in the members commentary each day. We encourage you to perform chart analysis and spot your own trades, as well as follow along with the analysis in the daily members trade ideas newsletter inside the members area.
The goal of this experiment is 3-fold:
1. To remove your fear of entering trades, get you pulling the trigger more often and trusting your judgement, to avoid living in a hindsight circle constantly (regretting not taking trades you knew you should have), to simply get you into the habit of executing trades rather than just spectating and hesitating.
2. To reveal the randomness of achieving a risk reward goal and reveal the truly random distribution of winners and losers.
3. To deter you from over-trading in the future, by the end of this experience you will understand that trading every signal and taking every trade will diminish your returns by churning your account of spread/commission and losing trades we could have avoided through filtering. To turn you from a machine gunner into a one shot one kill ‘sniper’
Rules and conditions of experiment:
The rules and conditions of this experiment are quite simple. However, you must follow them exactly for the intended lessons to have their effect and prove their point to you. The rules and conditions are as follows:
- Trade 1 micro lot or smaller or demo trade, but actually execute the trade on a broker platform for record keeping and exercising the habit of placing trades.
- Watch the 10 or so markets we follow in the daily members newsletter, and trade as many signals as you see fit, including pin bars , inside bars, fakeys, on 4 hour to daily charts (exclude any time frame under 4 hour).
- Apply a 2 to 1 risk reward with a minimum stop of 0.5% of the market price and minimum target of 1% of the market price (approx 50 pips stop and 100 pip target on Forex). For gold, and indices and commodities, adjust this accordingly.
- All trades are set and forget setups, meaning, you are either stopped out or achieve your target, no fiddling with the trade once it’s live.
- The goal is to determine overall R R (risk reward), we measure a loss as 1R (1 times risk) and profit as 2R (2 times risk), to learn more about why we measure results in R and not percentages, read our lesson on risk reward here.
Performing the experiment:
Here are two example trades so you can get accustomed to how you will actually carry-out this experiment.
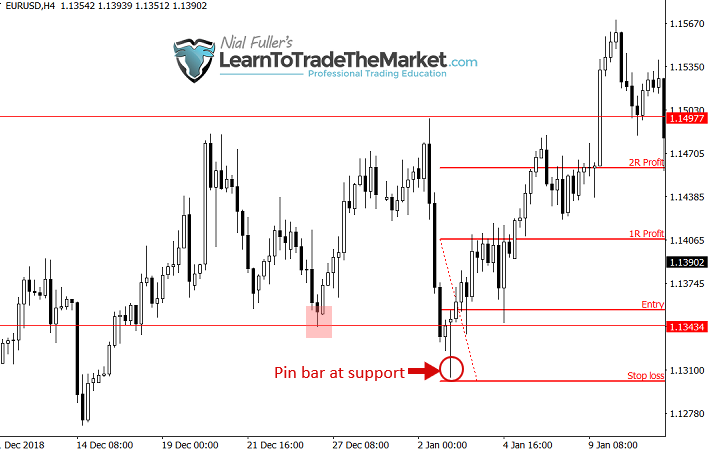
1. In the first example, we can see a 4-hour chart EURUSD pin bar signal that formed at a support level in the context of the recent trading range we have seen on this chart (see daily view too).
Once you spot a clear and obvious price action signal like the one below, you will simply set the stop loss (in this case below the pin low) and the entry (pin high) and the target (2 times risk), then you let the trade go.
You should also record the trade details in a spreadsheet / trading journal to track your trades and stay accountable, note that the risk reward is the most important piece of “evidence” for each trade.
We are setting the RR at a strict 2 to 1 and so whilst the stop loss placement can be somewhat discretionary (see article link for where you should place it) the profit target must always be two times the stop distance.

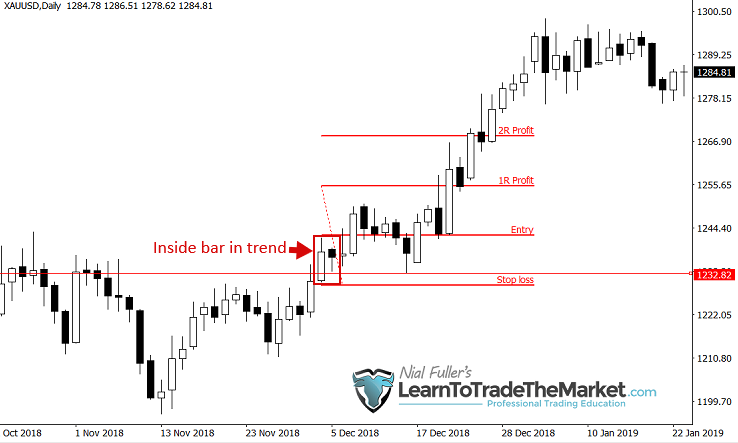
2. In the next example, we are looking at an inside bar signal that formed in a recent uptrend in Gold. This is a very simple trade to spot and set up, and to set and forget.
The stop loss is typically under the mother bar low and so the target is 2 times that of the stop loss distance. We can see in this case the target got hit for a win, as did the first example. However, not every trade will be a winner of course, and remember, one of the points of this experiment is to show you that you can’t take EVERY trade because some are not worth taking, you have to learn to filter the good from the bad.

Hopefully, after taking every signal you see for a month you will realize that the trades like these two above, that had confluence are the ones you want to take most of the time.
Other considerations…
Make sure that the price action signals you are taking are ones that I teach, you don’t want to be just trading anything you think is a pattern. You need to start trading an actual edge, that is the beginning. Blindly entering “every pin bar” or “every fakey setup” with no other supporting evidence, can indeed produce some amazingly profitable trades as you will discover, BUT overall, it’s not enough to achieve long-term consistent success. You will need to refine and filter that edge so that you are only taking the absolute highest probability occurrences of these setups (something I discuss in other lessons and teach in my pro trading course).
Traders should not approach the markets with pessimistic energy and try to “avoid” losing trades, because that is impossible. Every trader will have losses and make a bad call from time to time, no matter how good a chart reading technician they are. Traders should instead approach the markets with an optimistic energy and focus on finding winning trades that yield a substantial reward compared to their risk. This experiment is designed to get you pulling the trigger on trades and to avoid freezing up like a deer in headlights constantly (pessimistic energy). It is designed to teach you that your edge is going to produce winners and losers in a random fashion over xyz period of time, and that by being a little more selective with what trades you take in the future, you can improve your results substantially and place each trade with total confidence (optimistic energy).
When your done completing the experiment, there are going to be a tonne of trades you look back on and learn something from. You will want to study the ones that worked out really well and study the ones that didn’t work out well and find some common denominators that will then act as filters for your trades in the future. As you grow and learn as a trader, through your own experience, screen time, and through ongoing study, you will learn more about how to find the best price action trading opportunities in the market, and your eventual goal is to end up trading like a ‘crocodile’ , waiting in ambush for your ideal prey (your next high probability trade).
From here I would ask you to do 2 things right now.
1.Post your commitment to perform this experiment in the comments section below.
AND then
2. Come back and reply to your own comment below AFTER you complete the experiment with answers to the following:
- What did you achieve in overall profitability or losses ? example: 30 losses 20 wins and a total R return loss of -20 R ?
- What trading habits will you continue and what habits will you stop in the future ?
- Do you think you will be more selective and filter trades more carefully ?
- Any other lessons you want to share with others here ?
I hope you enjoyed today’s experiment-lesson, I truly believe if you follow it you will learn many lessons that most traders spend years learning through much trial and error.
Please Leave A Comment Below With Your Thoughts On This Lesson…
If You Have Any Questions, Please Contact Me Here.


