

NZDUSD extends gains
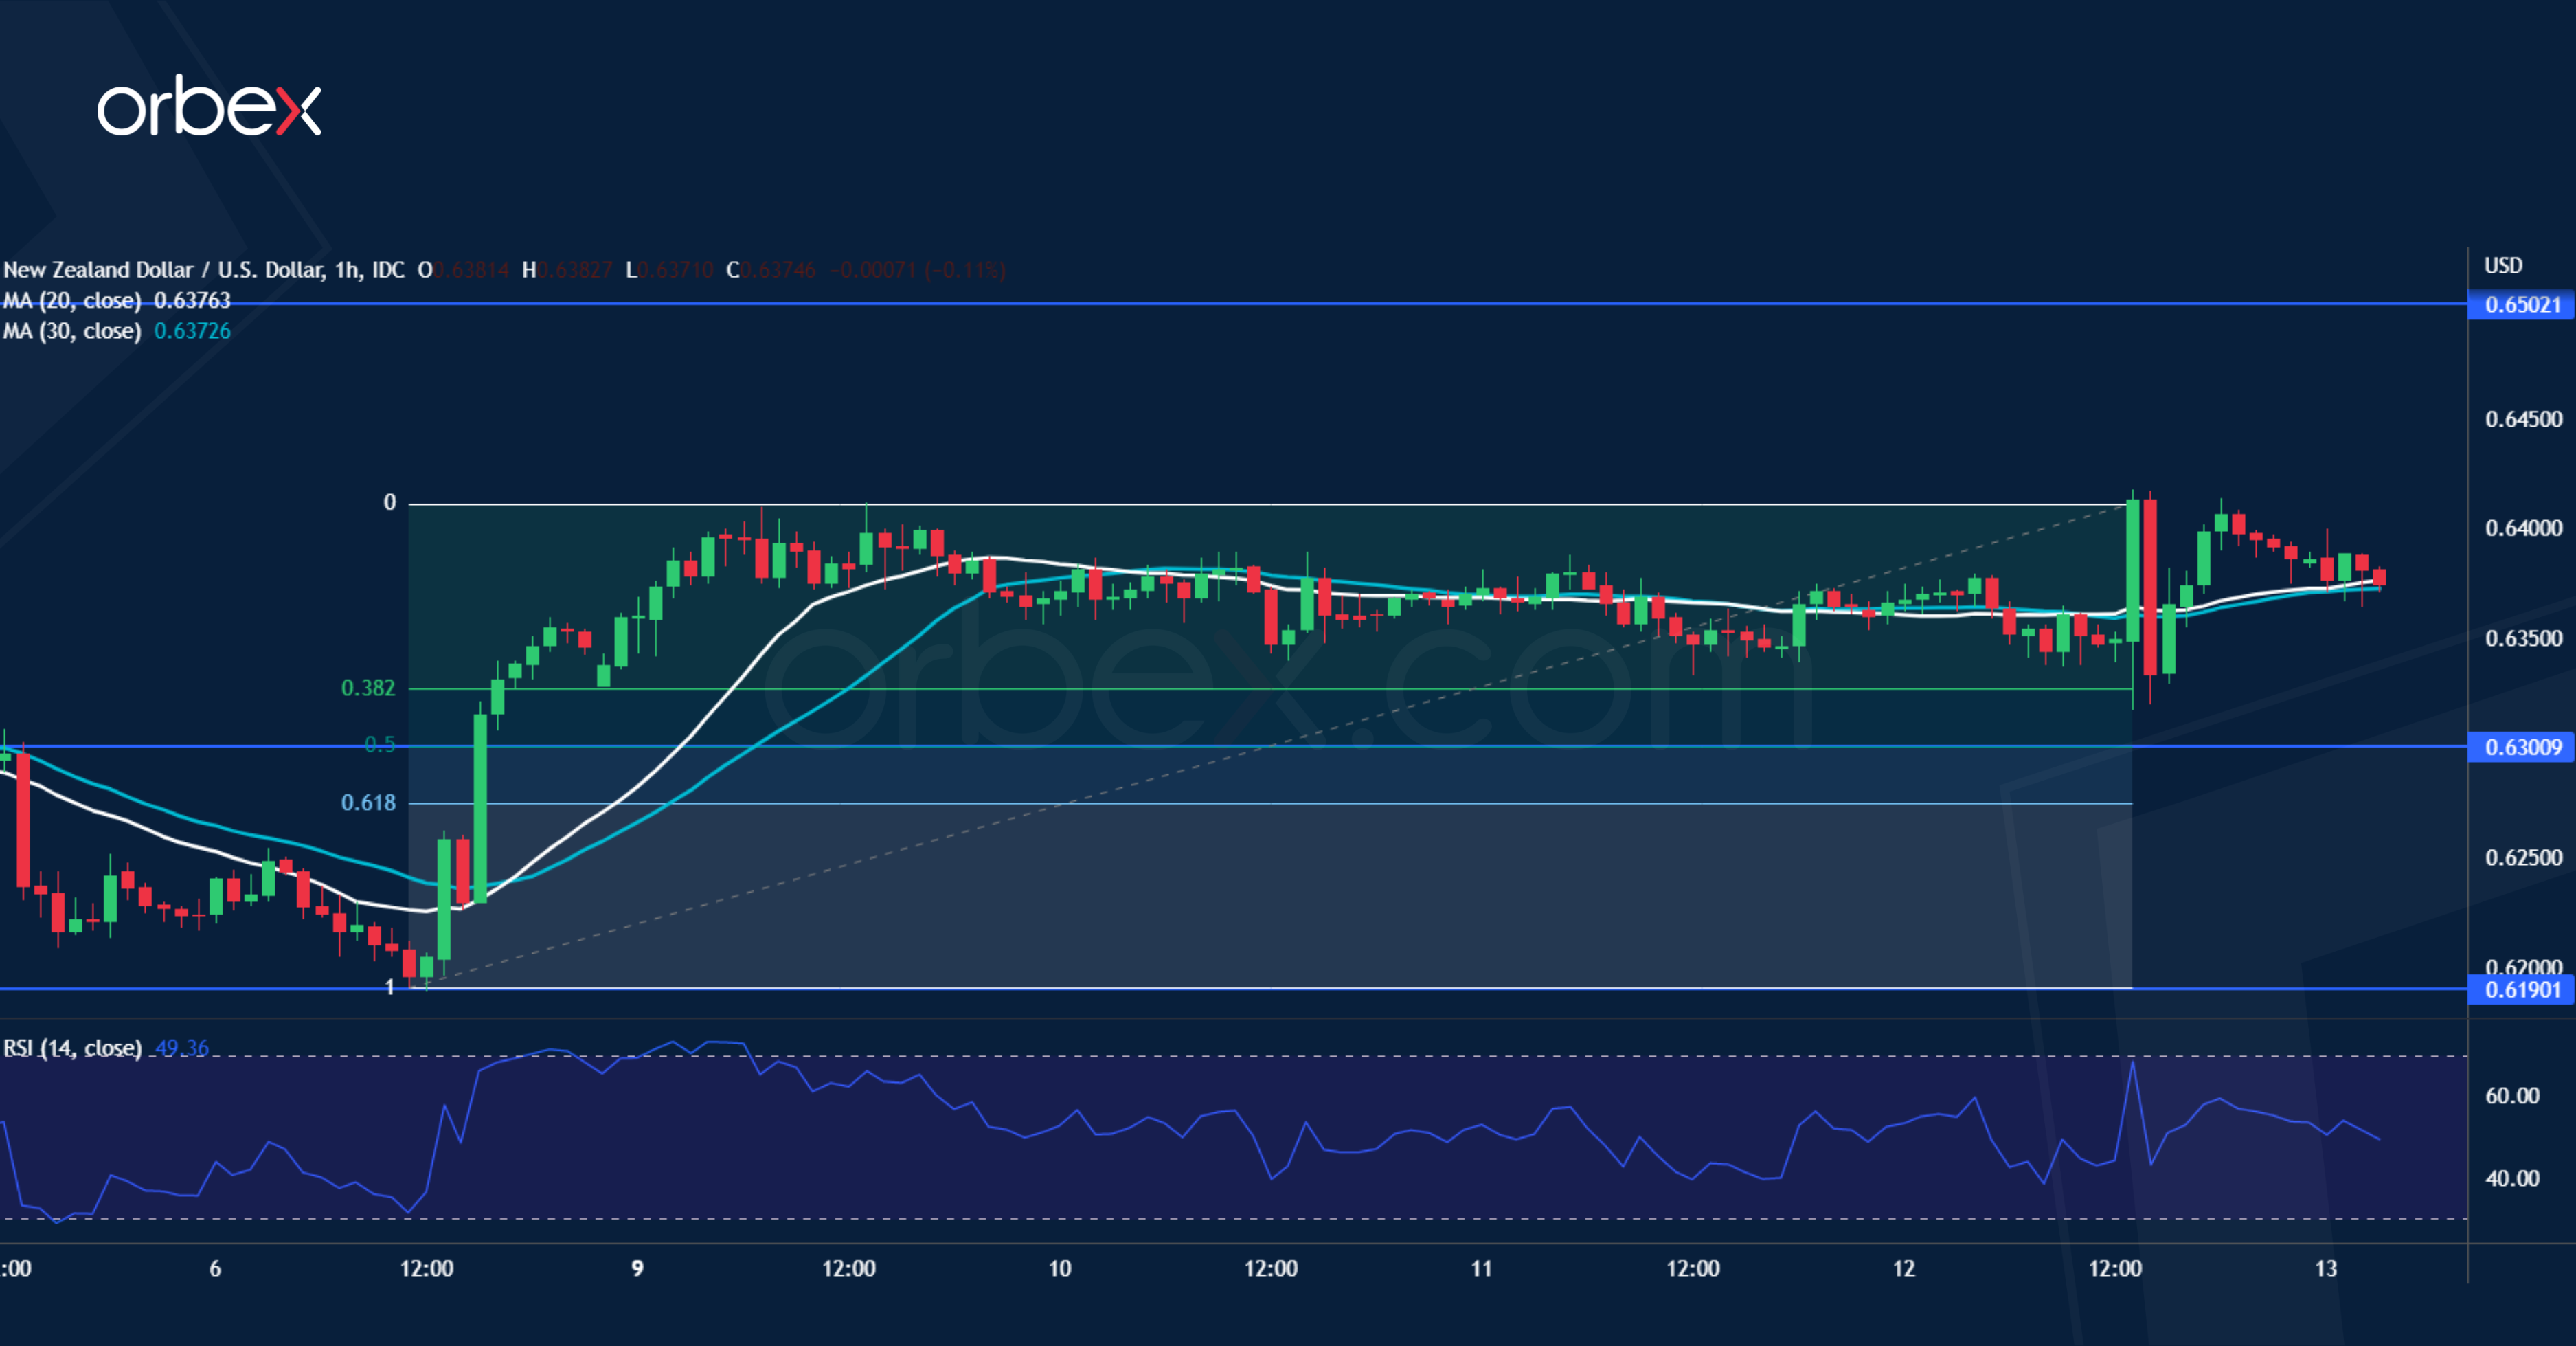
The US dollar struggles as a slowing CPI foreshadows a dovish Fed. On the daily chart, the upward bias has remained intact after the kiwi bounced off 0.6190.

The price then consolidated its gains after clearing the major supply zone around 0.6400. The 38.2% Fibonacci retracement level at 0.6330 coincides with a former swing high, making it a key level to find follow-up interest. The 50% level (0.6300) is a second layer of support. A close back above 0.6410 would open the door to the previous high at 0.6500.
EURJPY struggles for support

The Japanese yen rallied on rumours that the BOJ would review the side effects of its monetary easing. The pair turned south after it failed to lift offers at the daily resistance 142.85. A drop below 141.80 prompted buyers to bail out, extending losses to previous swing lows around 140.00. A tentative break below this psychological level would indicate that the path of least resistance is down and cause a retest of 138.00. The RSI’s oversold condition may attract some buying interest, with 140.50 as the first resistance.
NAS 100 bounces higher
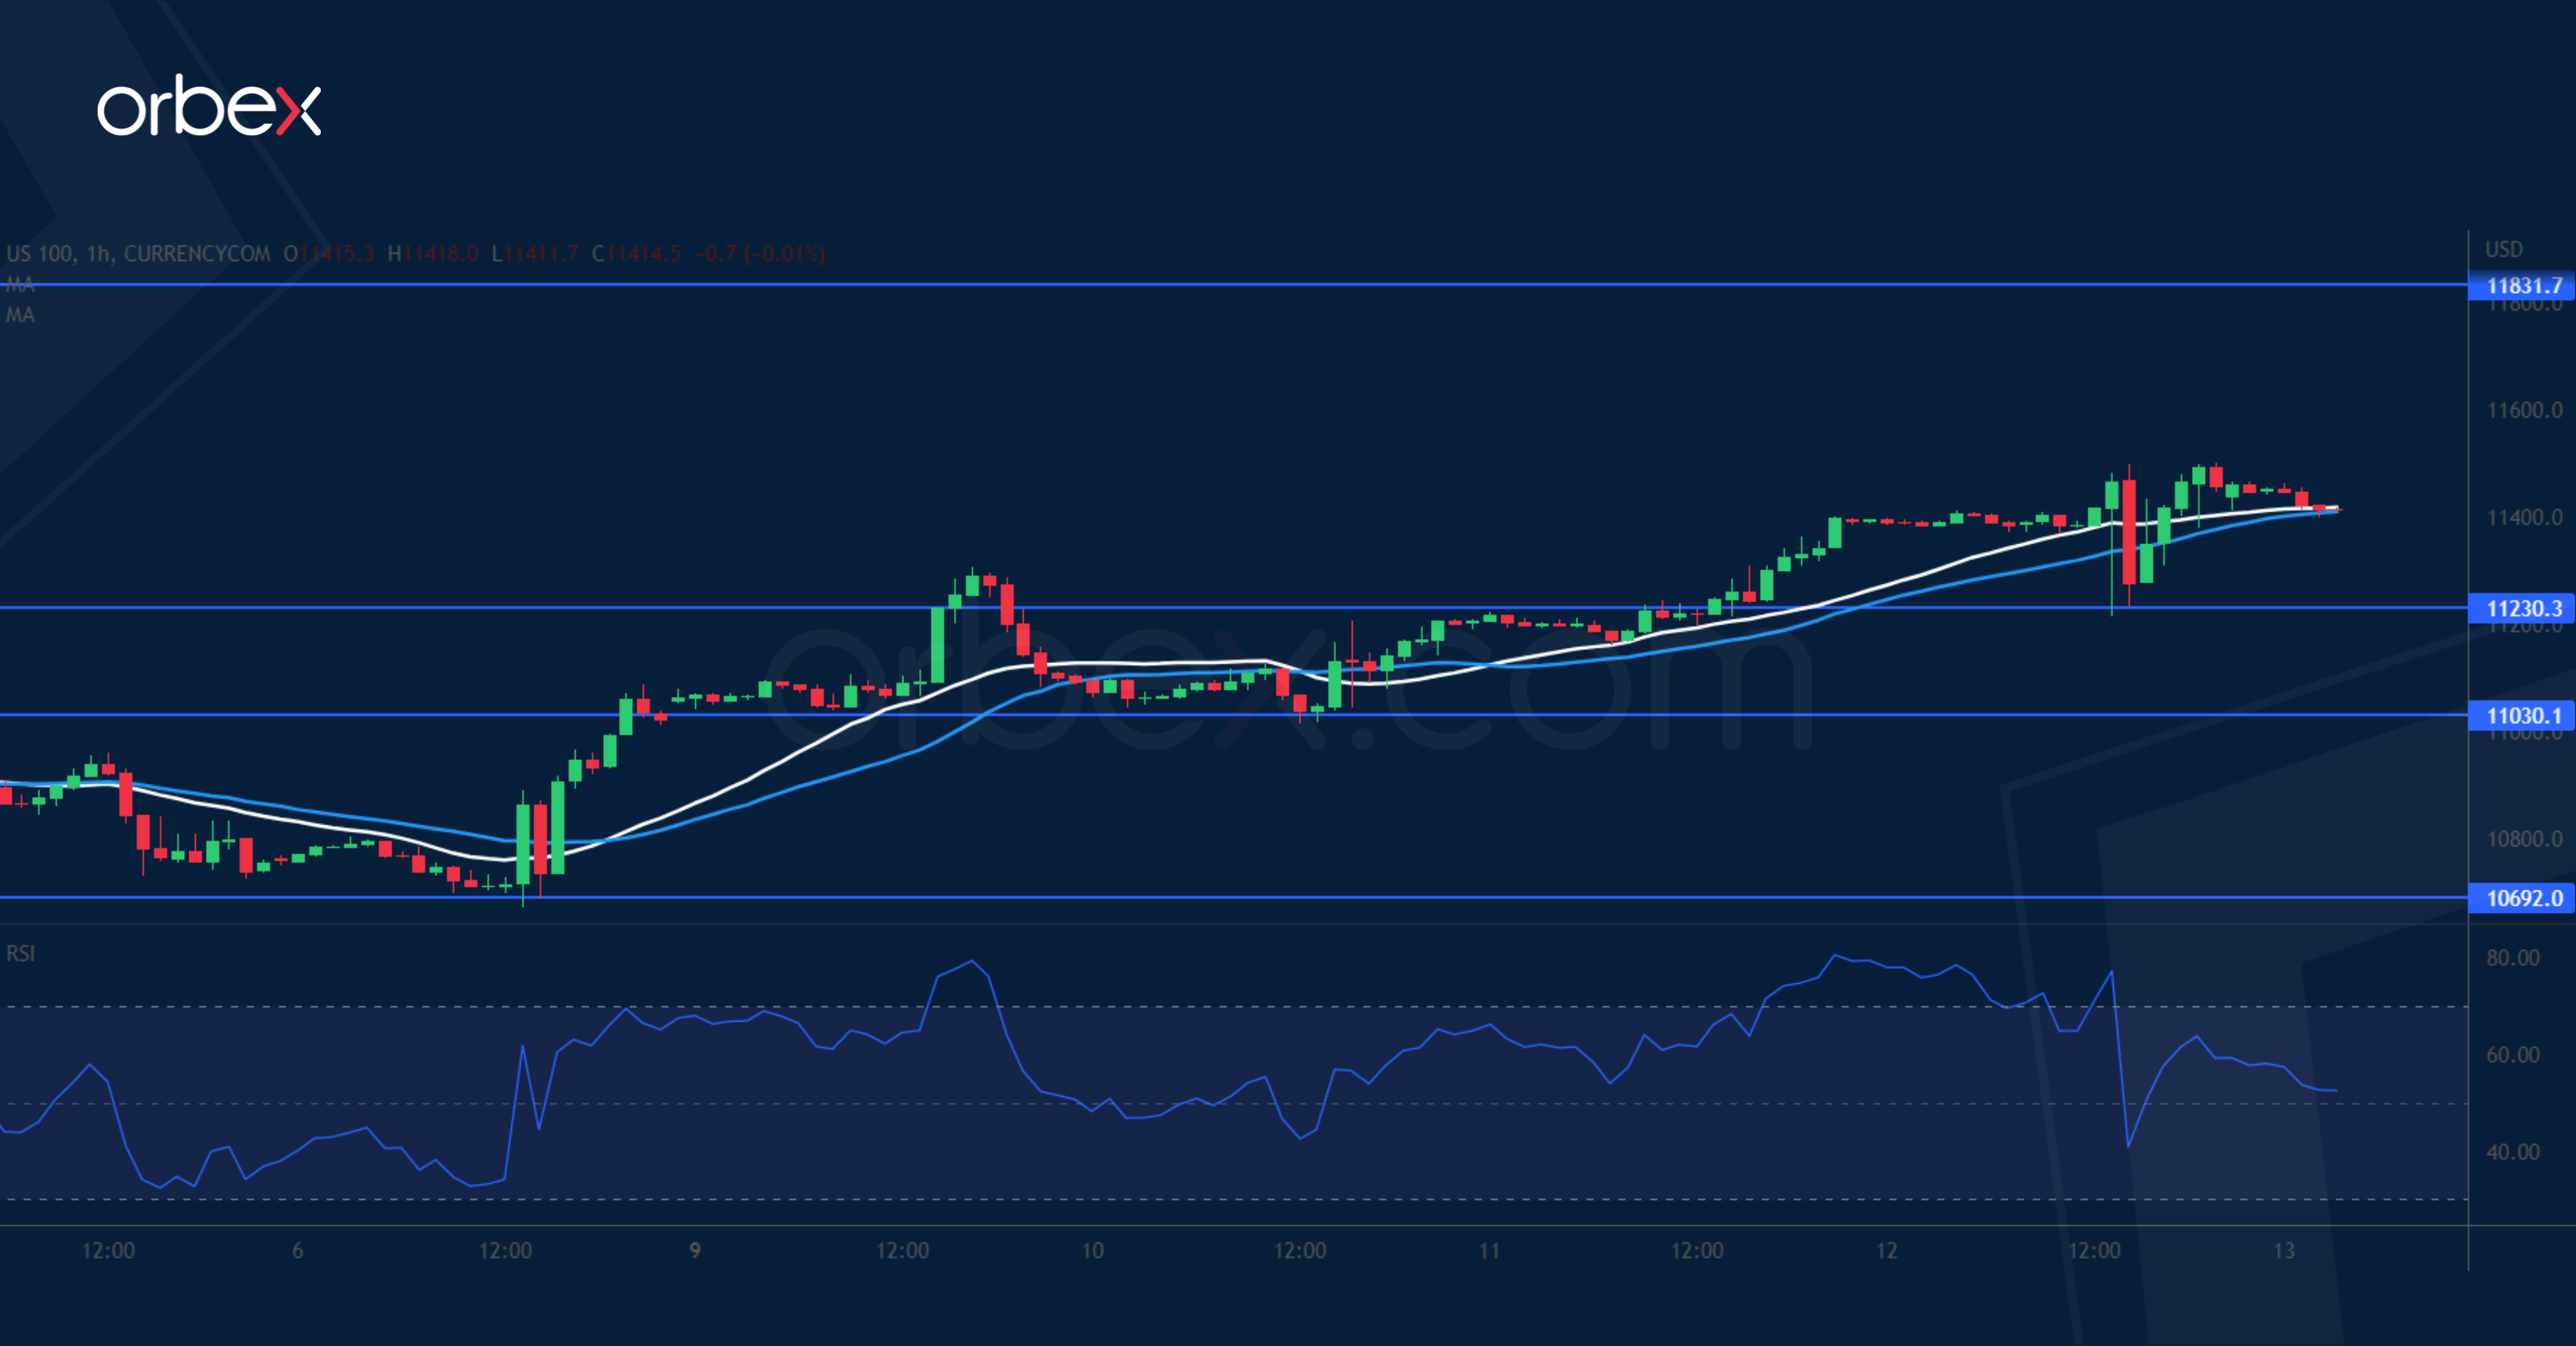
The Nasdaq 100 popped higher after data showed that US inflation might have reversed its course. A break above 11280 prompted sellers to cover their positions, easing the downward pressure. After the index had a secure footing over 11030, the subsequent rally suggests that the bulls have taken over. A whipsaw above 11230 indicates solid support as buyers were fast to keep the price action afloat. The start of the liquidation back in mid-December at 11830 could be the next target when momentum buyers get involved.
Test your strategy on how the USD will fare with Orbex