It is a very busy week of central bank actions, data, and earnings. Commanding most of the attention, however, will be monetary policy decisions from the FOMC, ECB, and BoE. Rate hikes are universally expected, but that is where the similarities end. Differences in growth and inflation will lead to differing outcomes and guidance. The Fed is widely expected to hike by 25 bps and the ECB by 50 bps. The BoE is seen tightening 50 bps, but there is increased risk for 25 bps. Find out more for BoE here.
Concurrently, there is a heavy data slate that will feed into the calculus for future decisions. Many key earnings reports are due too.
The FOMC meeting (Tuesday, Wednesday) dominates the US landscape. The policy decision will be announced on Wednesday at 19:00 GMT. A stepped down 25 bp hike to a 4.625% rate is widely expected after downshifting to 50 bps in December following four straight 75 bp boosts, even though a still tight labor market and elevated inflation argue for another 50 bp move so that the terminal rate can be achieved as quickly as possible.
Comments from Governor Waller, one of the most hawkish on the Committee, who added his support for a further tapering to 25 bps largely sealed the deal. But, many believe a 50 bps is warranted. Also policymakers’ desire to achieve the terminal rate as quickly as possible argue for a 50 bps increase.
Additionally, the financial markets have continued to ease, something Powell was concerned about and which showed up in the December minutes: “participants noted that…an unwarranted easing in financial conditions, especially if driven by a misperception by the public of the Committee’s reaction function, would complicate the Committee’s effort to restore price stability.“
Those factors could push-back from Powell in his press conference, while markets do not expect him to follow the BoC which slowed its rate hikes to 25 bps and announced a pause. Hence, a more hawkish tone from Chair Powell should be seen. He is likely to again push back against Fed funds futures that are showing a 4.9% peak rate, less than the 5.1% median dot, and stress that rate cuts are not in the outlook this year.
Furthermore, we suspect Powell will warn that the easing in financial conditions will complicate the actions to bring inflation back to the 2% target. It could behoove him to stress the rate path remains data dependent, rather than offer hints on the next move in March and beyond.
A knee-jerk bearish response is likely in bonds and stocks if he pushes back, but it is unlikely the move will last as the markets are likely to revert back to anticipating a less hawkish Fed as inflation continues to decelerate and growth slumps with risk of a Q1 contraction.
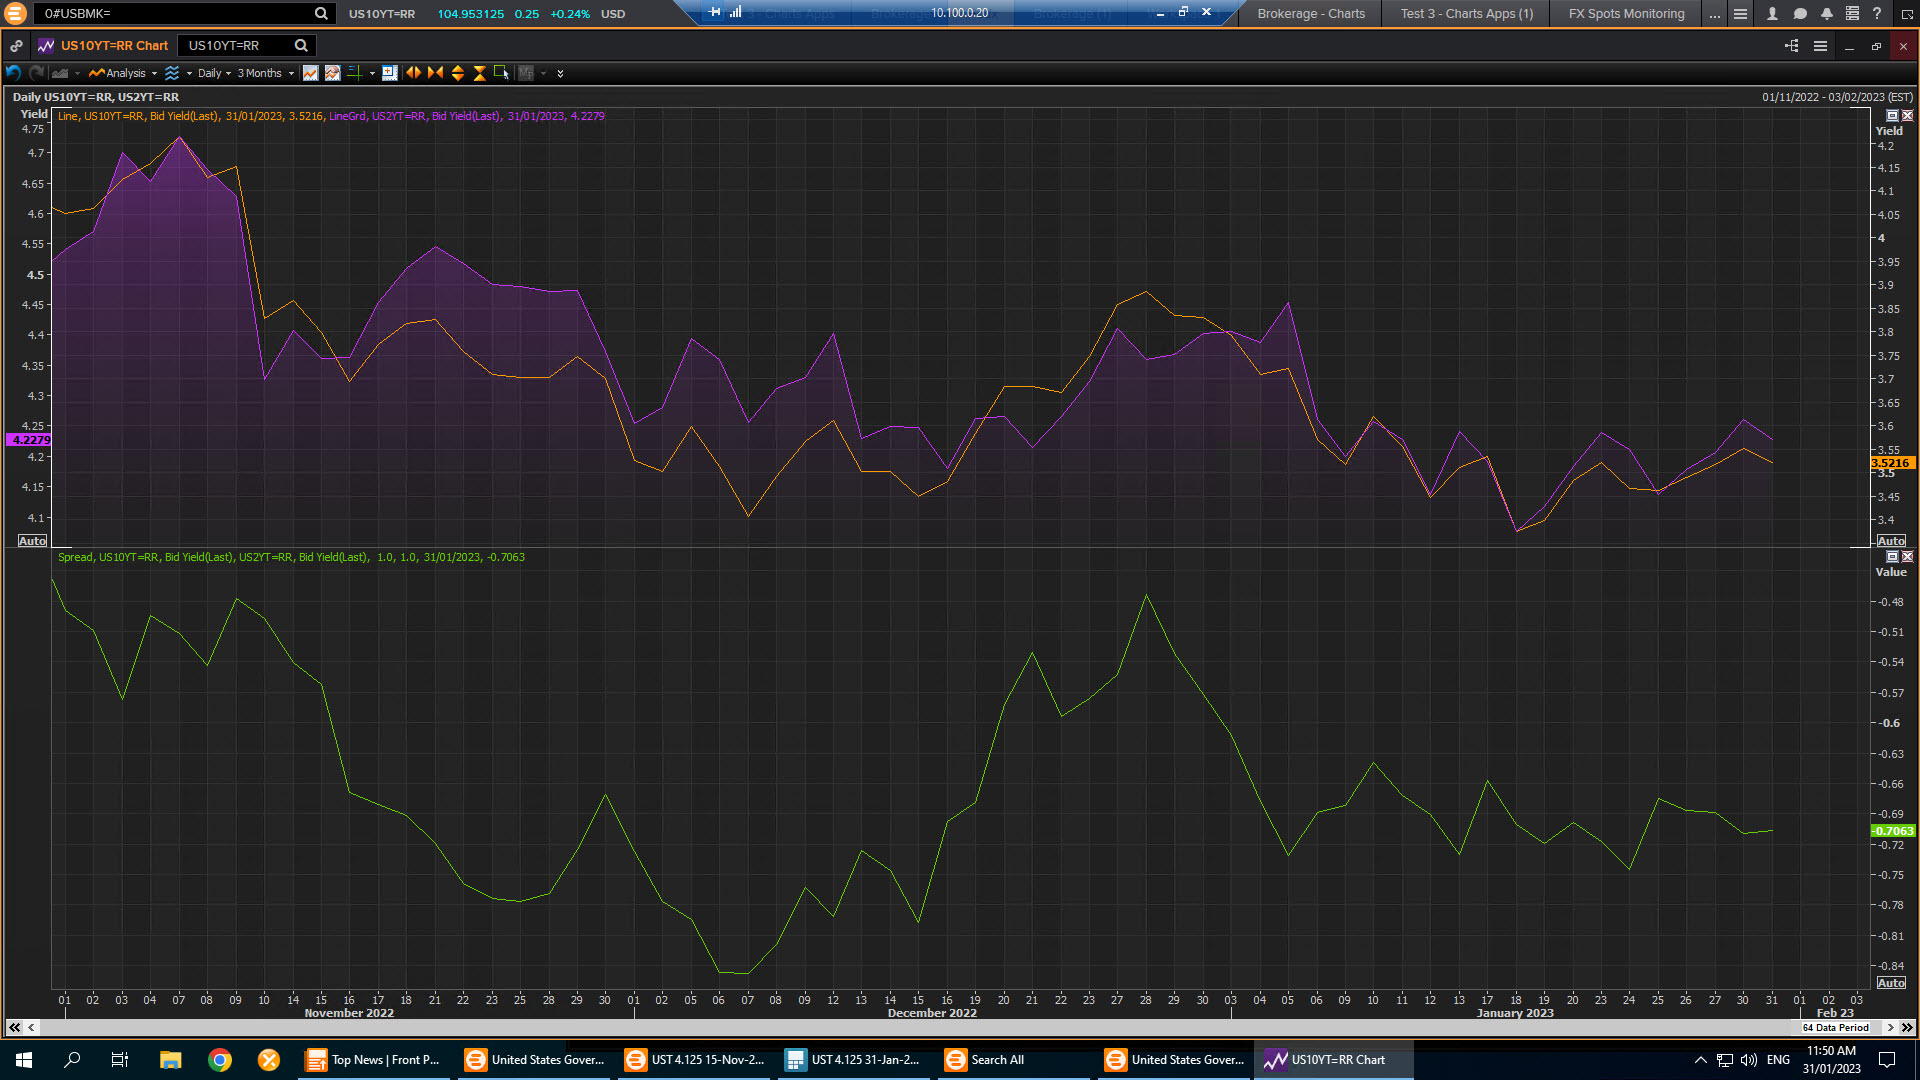
Currently meanwhile, Treasury yields extend their declines. The 2-year rate is down about 4.3 bps to 4.191%, the 5-year is 5.7 bps lower at 3.605%, and the 10-year is off 4.6 bps to 3.49%. The curve is little changed at -70 bps. About where it’s been all year.
Just a quick reminder at this point that thsi pattern, known as a yield curve “inversion”,and has preceded every US economic downturn of the past 50 years. An inverted yield curve shows that short-term debt instruments have higher yields than long-term instruments of the same credit risk profile — meaning that long-term interest rates are less than short-term interest rates. An inverted Treasury yield curve, historically proven as one of the most reliable leading indicators of an impending recession.
The deepening of the inversion is seen amid an ongoing tight labor market in the US economy and indications taht activity in the vast services sector is continuing to grow rapidly. However the Fed agressive policy leading to higher borrowing costs, in turn, are expected to heap pressure on the economy and potentially trigger a recession. Thats turns NFP data on Friday, extremely significant both for fed but also for confurming the avoidance or not of a recession in the US.
As we can seen in the yields chart above, the key signal that we could derive from the yield curve inversuin is that market participants believe the Fed’s increases in short-term rates will be successful in sharply slowing inflation even if it must sacrifice forward-looking growth or recession. The magnitude of this inversion then reflects both the dramatic pace of rate increases, and the fact that the Fed has stuck with that pace even as investors have shifted their expectations on inflation and growth.
As Mark Cabana, head of US rates strategy at Bank of America said: “We think the shape of the yield curve is a measure of the extent to which monetary policy can tighten, and the market clearly thinks that tightness is going to persist for quite some time”.
Chekout our articles for Yield Curves and Economic Performance .
Click here to access our Economic Calendar
Andria Pichidi
Market Analyst
Disclaimer: This material is provided as a general marketing communication for information purposes only and does not constitute an independent investment research. Nothing in this communication contains, or should be considered as containing, an investment advice or an investment recommendation or a solicitation for the purpose of buying or selling of any financial instrument. All information provided is gathered from reputable sources and any information containing an indication of past performance is not a guarantee or reliable indicator of future performance. Users acknowledge that any investment in Leveraged Products is characterized by a certain degree of uncertainty and that any investment of this nature involves a high level of risk for which the users are solely responsible and liable. We assume no liability for any loss arising from any investment made based on the information provided in this communication. This communication must not be reproduced or further distributed without our prior written permission.


