- Gold price continued to extend its weekly gains, above the $1,900 mark.
- Trader’s speculations that the US Federal Reserve would slow rate hikes pace boosted Gold prices.
- Gold Price Analysis: Daily close above $1,920 could pave the way toward $2,000.
Gold price hit a new 9-month high at $1,913.18 on Friday, amidst investors’ speculations that the US Federal Reserve (Fed) could shift to a less aggressive stance following the release of softer inflation data. Therefore, XAU/USD is trading at $1,912, gains 0.82%, headed for a fourth consecutive week of gains.
XAU/USD got bolstered by speculations of a less hawkish Fed, falling US bond yields
Global equities remain mixed, while Wall Street is headed for a soft opening. Earnings season began in the United States (US), with banks like Bank of America and JP Morgan topping expectations, while Wells Fargo missed estimates, as reported by Q4 results. Thursday’s US inflation report, which witnessed December’s Consumer Price Index (CPI) dropping beneath 7% and core CPI below 6%, was cheered by the financial markets.
In the meantime, the greenback is staging a recovery though it’s been ignored by Gold traders. The US Dollar Index, which tracks the buck’s value against a basket of peers, is trimming some of its weekly losses, gaining 0.18%, at 102.418.
Another reason bolstering XAU/USD’s recent price action is US Treasury bond yields. The 10-year benchmark note rate tumbles one bps, down at 3.434%, though it has fallen 12 bps in the week.
According to the CME FedWatch Tool, odds for a 25 bps rate hike by the Federal Reserve lie at a 94.2% chance after the release of US inflation.
Meanwhile, the University of Michigan’s Consumer Sentiment for January beat estimates of 60.5 and reached 64.6. Regarding consumer inflation expectations, for one year, it dropped from 4.4% to 4%, while for a 5-year horizon ticked to 3% from 2.9%.
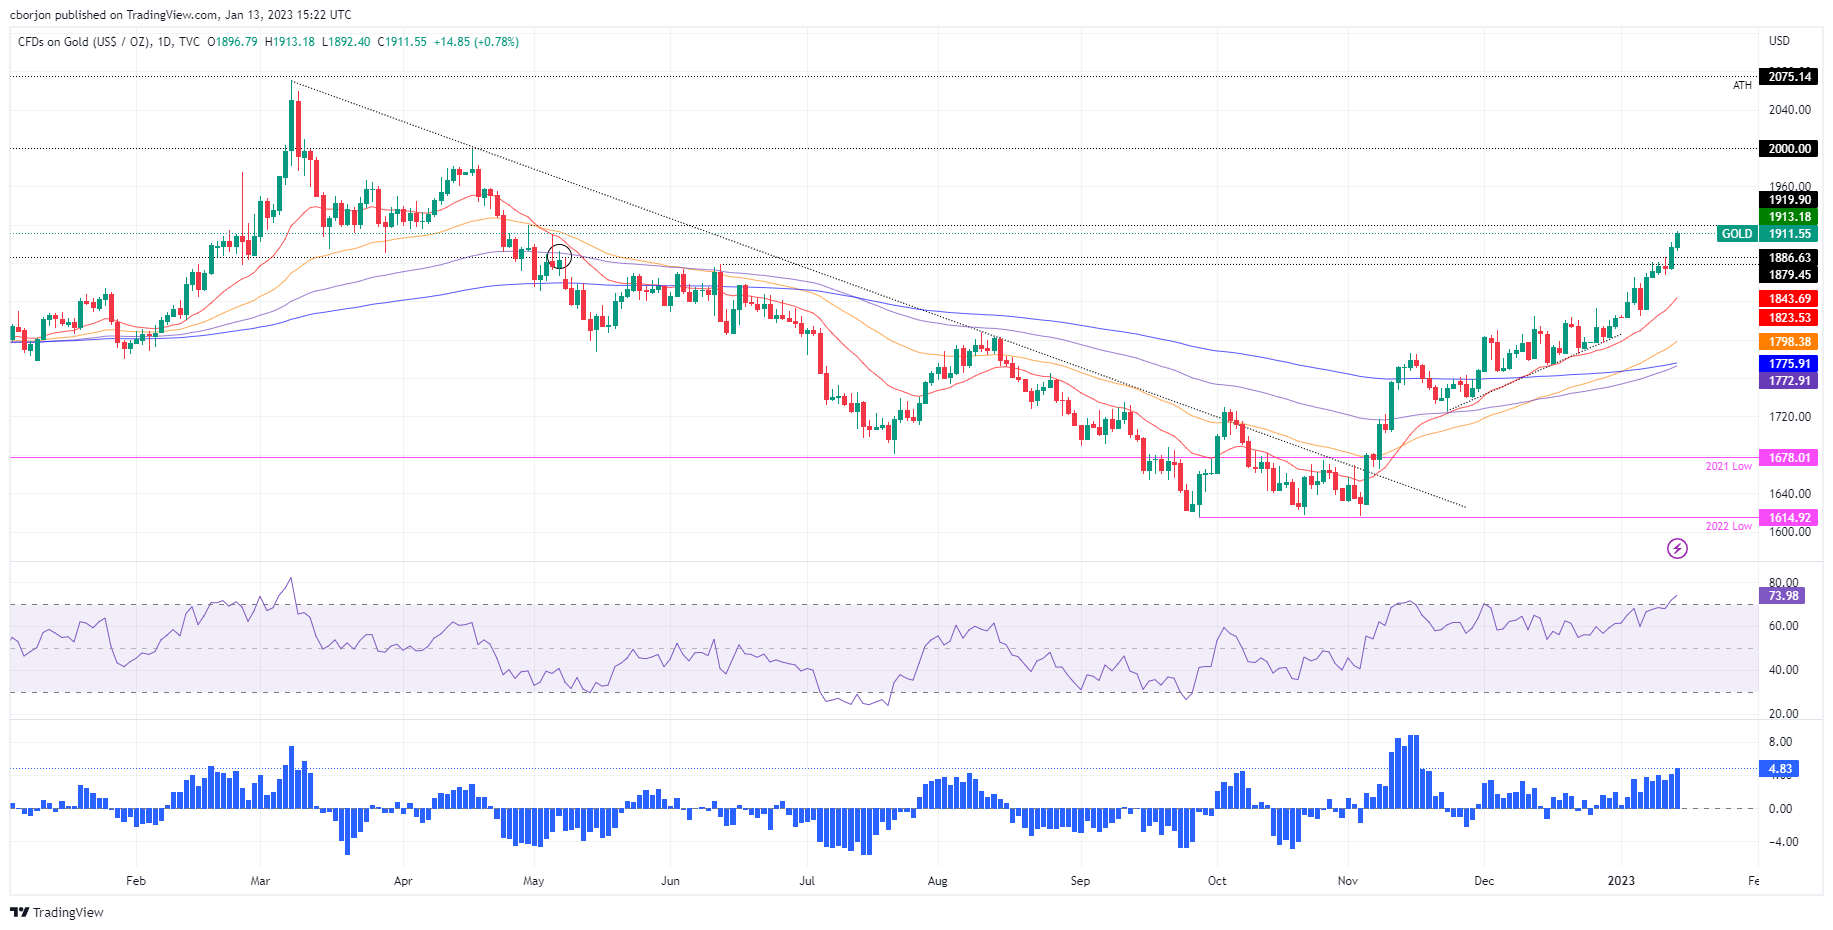
Gold Price Analysis: Technical outlook
From a daily chart perspective, XAU/USD would likely continue to edge higher, as it has broken May 5, 2022, daily high of $1909.80. Oscillators like the Relative Strength Index (RSI) at overbought conditions but still beneath the 80 mark suggest the uptrend continues to gain strength. While the Rate of Change (RoC), portrays that buyers are gathering momentum.
Gold key resistance levels would be the April 29 high of $1,919.90, followed by April 18 at $1,998.39, slightly below $2,000.