- Gold price is expected to continue its downside journey to near $1,850.00 as US yields have strengthened.
- The speech from Fed chair Jerome Powell will provide the likely monetary policy action ahead.
- Goldman Sachs sees two more interest rate hikes by the Fed in March and May.
Gold price (XAU/USD) has resumed its downside journey after a short-lived pullback to near $1,870.00 in the Asian session. The precious metal is exposed to the critical support of $1,850.00 amid a sheer decline in US government bonds. The 10-year US Treasury yields have escalated their recovery to near 3.57%.
S&P500 futures are showing further losses, portraying a significant drop in the risk appetite of the market participants. The US Dollar Index (DXY) is aiming to scale above 102.80 amid the risk aversion theme. Investors are dumping United States equities as the impressive US employment will compel the Federal Reserve (Fed) the continuation of policy tightening, which will strengthen US recession fears.
For further guidance, the street will focus on the speech from Fed chair Jerome Powell, which is scheduled for Tuesday. Fed Powell is expected to sound hawkish on interest rate guidance amid an extremely tight labor market.
Goldman Sachs Research team said in its client note that it expects the Fed to hike interest rates by 25 basis points (bps) consecutively in March and May. This way the central bank will reach the terminal rate of 5.00-5.25%. The client note claims that the Gross Domestic Growth (GDP) growth will slow to 1.4% in 2023, reflecting a negative impact from tighter financial conditions.
Gold technical analysis
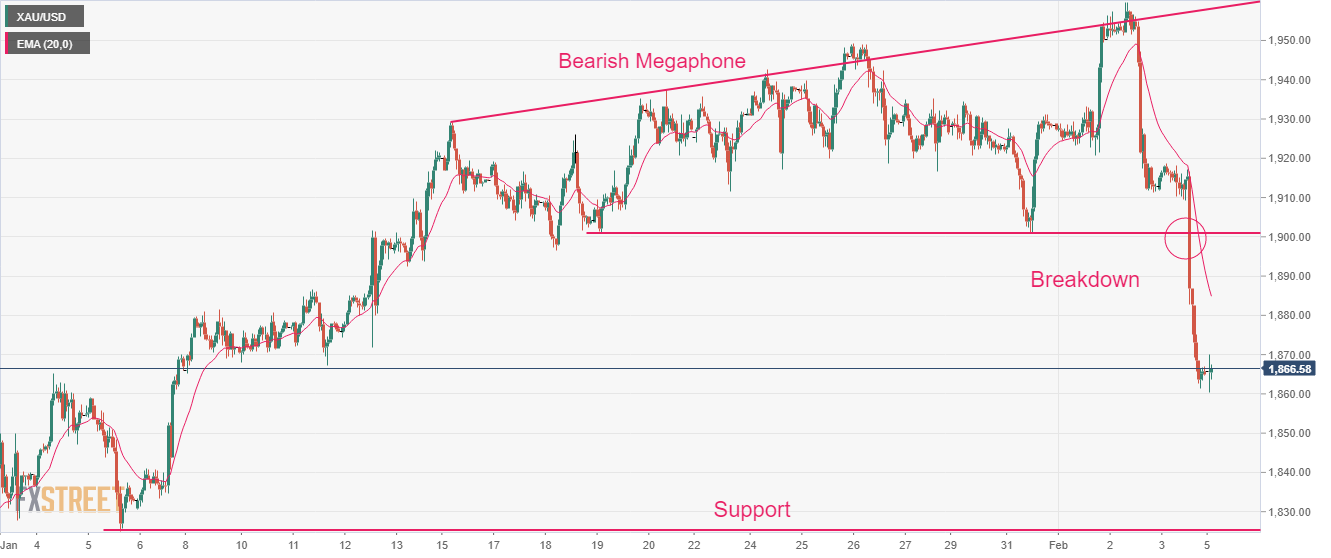
Gold price has demonstrated a nosedive move after delivering a breakdown of the Bearish Megaphone chart pattern that replicates a broadening triangle. The Gold price might find a cushion around the potential support placed from January 5 low around $1,825.08.
The precious metal has extremely diverged from the 20-period Exponential Moving Average (EMA), therefore a mean reversion to the former cannot be ruled out. However, the bearish trend-following action will continue amid the absence of any recovery signals yet.
The Relative Strength Index (RSI) (14) is oscillating in the bearish range of 20.00-40.00, portraying that the downside momentum is extremely solid.
Gold hourly chart