
USD/JPY PRICES, CHARTS and ANALYSIS:
Recommended by Zain Vawda
Download the Updated Q1 2023 Yen Forecast
Most Read: US Dollar Blazes Higher on Solid Data as Geopolitics Play Out. Where to for USD?
USD/JPY FUNDAMENTAL BACKDROP
USD/JPY hit a fresh 3-week high in the Asian session trading above the 132.00 handle. The European open has seen some pullback as the dollar index seems to be retracing following Fridays extended rally.
Currency Strength Chart
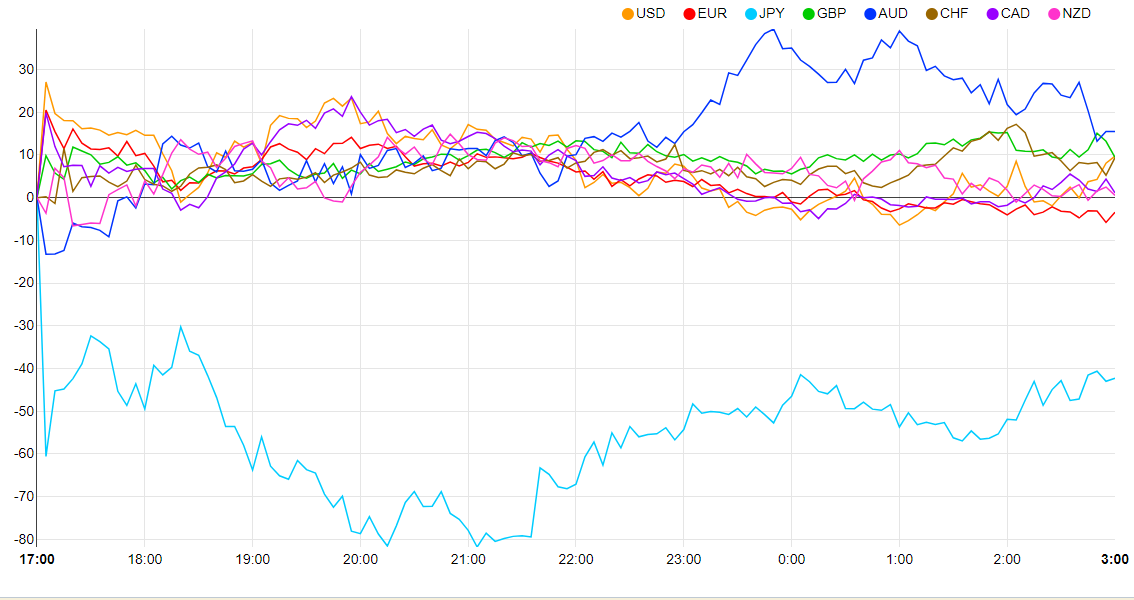
Source: FinancialJuice
The Yen came under pressure in the Asian session following a report by the Nikkei that the Japanese Government had approached Deputy Bank of Japan (BoJ) Governor Masayoshi Amamiya as a potential successor to Governor Kuroda. Amamiya is seen as one of the architects of the BoJ’s loose monetary policy and this showed as the Yen declined. Market participants are of the opinion that Deputy Governor Amamiya will continue with Governor Kuroda’s policies. The Japanese government has since dispelled the rumors that they had approached Amamiya with the new BoJ Governor to be announced sometime in February.
Recommended by Zain Vawda
How to Trade USD/JPY
Geopolitical tensions have ratcheted up between the US and China. The US brought down what it called a Chinese spy balloon off the coast of South Carolina which entered US airspace. The US Defence Department released a statement over the weekend stating that Chinese Balloons entered US airspace 3 times during the previous administration. The news is likely to weigh on sentiment as markets were hoping for a swift return of demand from the Chinese economy during the month of February.
TECHNICAL OUTLOOK
From a technical perspective, USD/JPY had a significant weekly candle close last week, breaking above the descending trendline and the psychological 130.00 level. The weekly candle closed as a hammer candlestick with little to no upside wick, a sign of the bullish momentum in play. We did gap up over the weekend and the potential to close the gap at 131.200 before moving high remains a possibility. On the upside, we have the 50-day MA which could provide resistance around the 133.90 Level with horizontal resistance resting at the 134.45 handle.
USD/JPY Weekly Chart – February 6, 2022
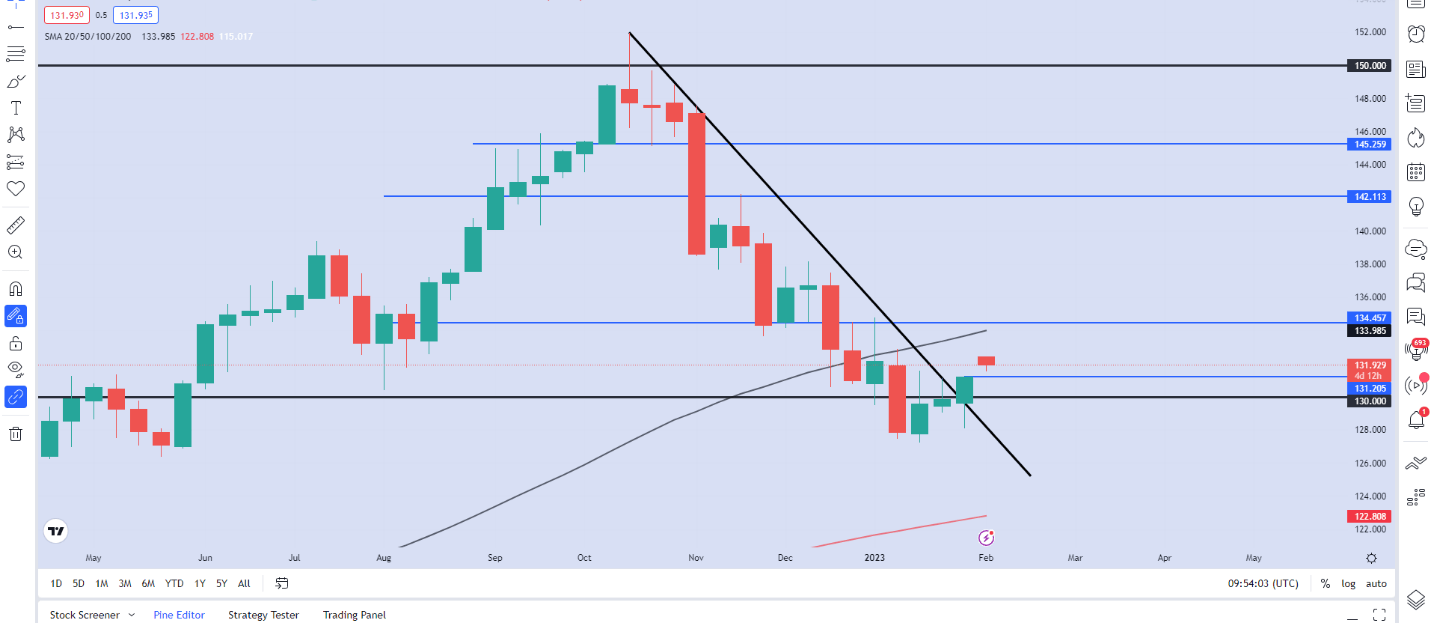
Source: TradingView
IG CLIENT SENTIMENT DATA: MIXED
IGCS shows retail traders are currently SHORT on USD/JPY, with 59% of traders currently holding short positions. At DailyFX we typically take a contrarian view to crowd sentiment, and the fact that traders are short suggests that USD/JPY may continue to rise.
Written by: Zain Vawda, Markets Writer for DailyFX.com
Contact and follow Zain on Twitter: @zvawda