
US Dollar Talking Points:
- The US Dollar started the year with a subtle show of strength but that was soundly rebuked on Friday after the release of PMI numbers.
- The big US driver for this week is CPI which is set to be released on Thursday. Markets are looking for a move down to 6.5% for headline CPI and 5.7% for Core CPI, from prior reads of 7.1% and 6%, respectively.
- Last month’s inflation came out well-below expectations, but still triggered a strong sell-off in stocks that continued through the FOMC rate decision taking place a day later.
- The analysis contained in article relies on price action and chart formations. To learn more about price action or chart patterns, check out our DailyFX Education section.
Recommended by James Stanley
Get Your Free USD Forecast
The US Dollar is sinking to a fresh low this morning after a bullish breakout last week was soundly rebuked.
The USD had built in a rather consistent range over a three-week-period, with prices dropping down to a support level in mid-December after the release of CPI. That support held at 103.45 over a couple of different iterations and on the other side, resistance held around the 105 psychological level on DXY. Last Thursday morning saw bulls push price outside of that range into a busy Friday morning of data. The NFP report released at 8:30 AM gave the initial spark, and sellers pushed prices back to 105; but it was the PMI report released at 10 AM that really slammed the door on the matter.
Services PMI was expected to print at 55 and instead came out at 49.6. This was the lowest read since March of 2020 and given that it’s considered a leading indicator, the immediate read was that this was another sign that the Fed’s rate hikes are starting to have a massive impact on the economy.
US Dollar Two-Hour Chart
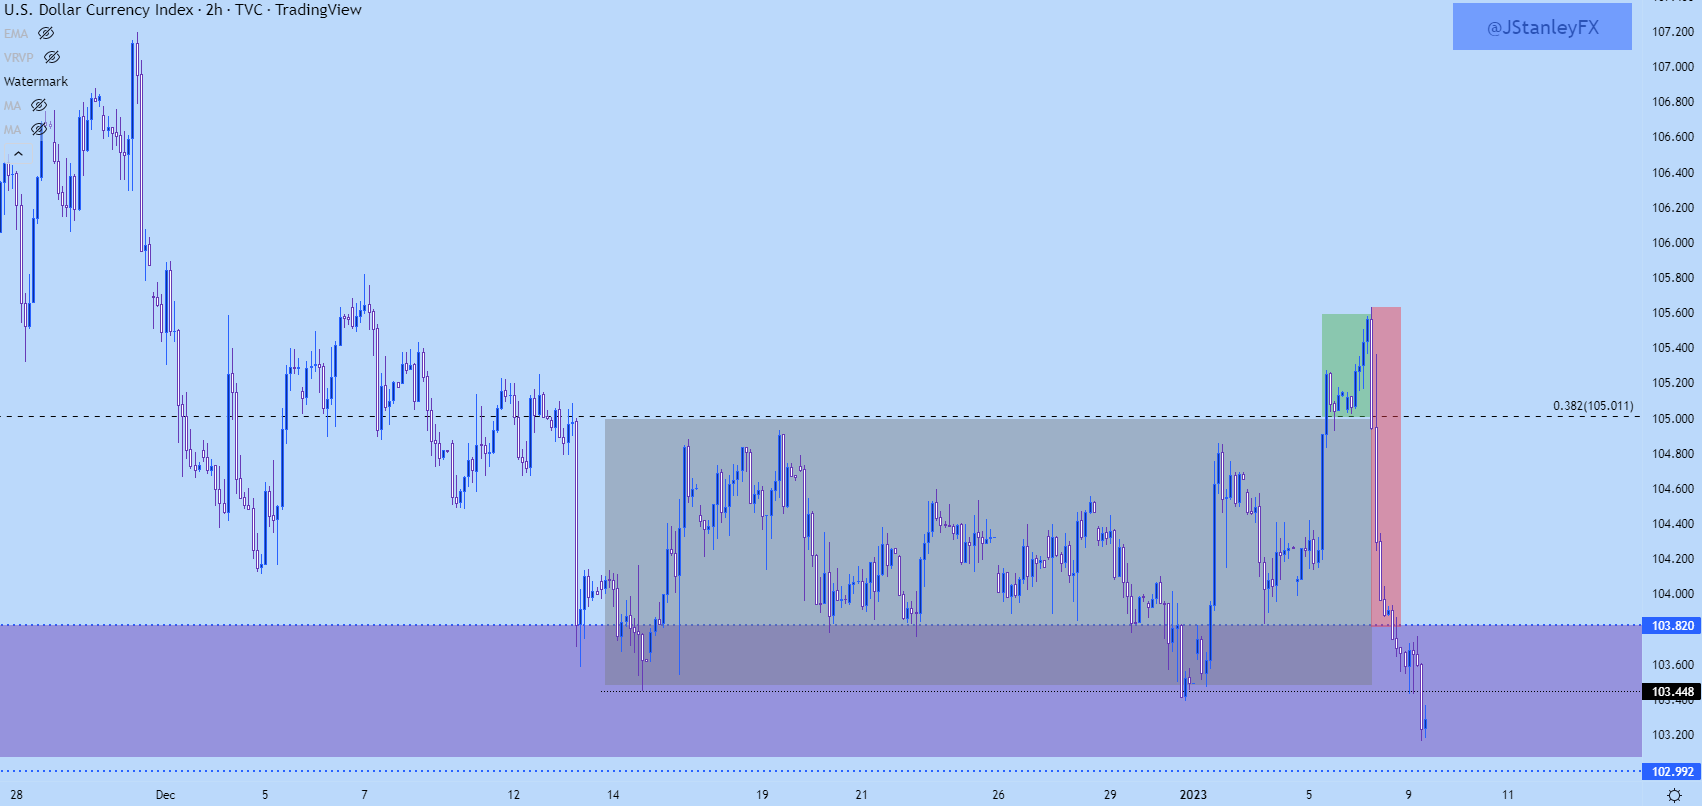
Chart prepared by James Stanley; USD, DXY on Tradingview
The USD response to the PMI report on Friday carries expectation for some element of response from the Fed; something that would cause the bank to be more-dovish moving-forward for fear of how much damage might reverberate from the hikes that they’ve already done, much less the hikes they have planned on the road ahead.
Whether this trend can continue is the bigger question. CPI has been a major driver for prices given the intense focus on inflation but, last month we started to see a different response than what was seen for much of last year.
For most of last year, higher rates of inflation led to USD-strength and equity weakness, with the logical relationship of higher rates of inflation leading to expectations for higher rates. But there was a shift in Q4…
In October, CPI came out above expectations and initially, we saw the typical move show of USD strength and equity weakness. But this was a fleeting observation as minutes later each move started to reverse and by the end of the day, USD-weakness and equity strength were playing a greater role.
Over the next two months, stocks continued to rally as the US Dollar broke-down and that theme pretty much dominated Q4 trade. It wasn’t until the final two weeks of the quarter when it started to come into question and this, once again, started to show around a CPI print.
The CPI print that was released in December was below expectations, so the opposite of what happened in October. And, like what happened in October, the opposite of what one would expect happened, with stocks evacuating their bullish trends and the USD drilling down to support. The FOMC rate decision a day later extended each move but, after that, prices settled into ranges that lasted for at least a couple of weeks and into the end of the year. Until last week’s breakouts, that is.
US Dollar Four-Hour Price Chart
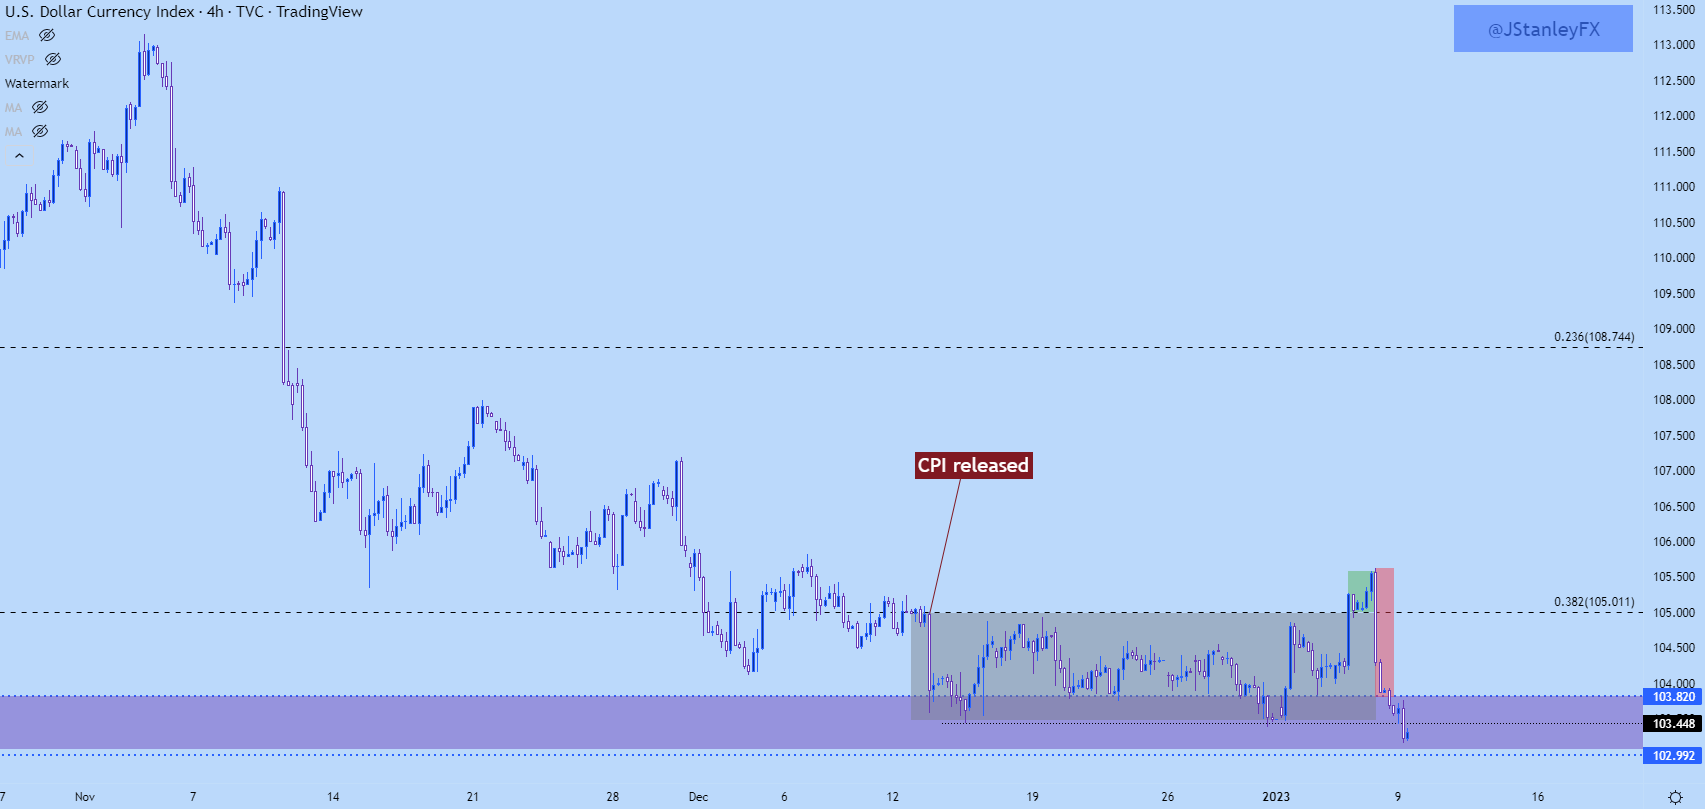
Chart prepared by James Stanley; USD, DXY on Tradingview
USD Juxtaposition
Last week’s weekly bar closed as an inverted hammer formation. These are often found near market bottoms as it’s indication that the market tried to rally but couldn’t continue the move. And that’s pretty much explained by the bullish breakout that was soundly reversed on Friday morning. The daily bar, however, finished as a bearish engulf which is usually tracked with the aim of continuation and that’s what’s showing so far today.
The next spot of support for the US Dollar is a little lower, around the 103 handle on DXY. This is the swing-high from 2020 and it’s also confluent with a bullish trendline taken from May 2021 and January 2022 swing lows.
Recommended by James Stanley
Get Your Free Top Trading Opportunities Forecast
US Dollar Weekly Chart
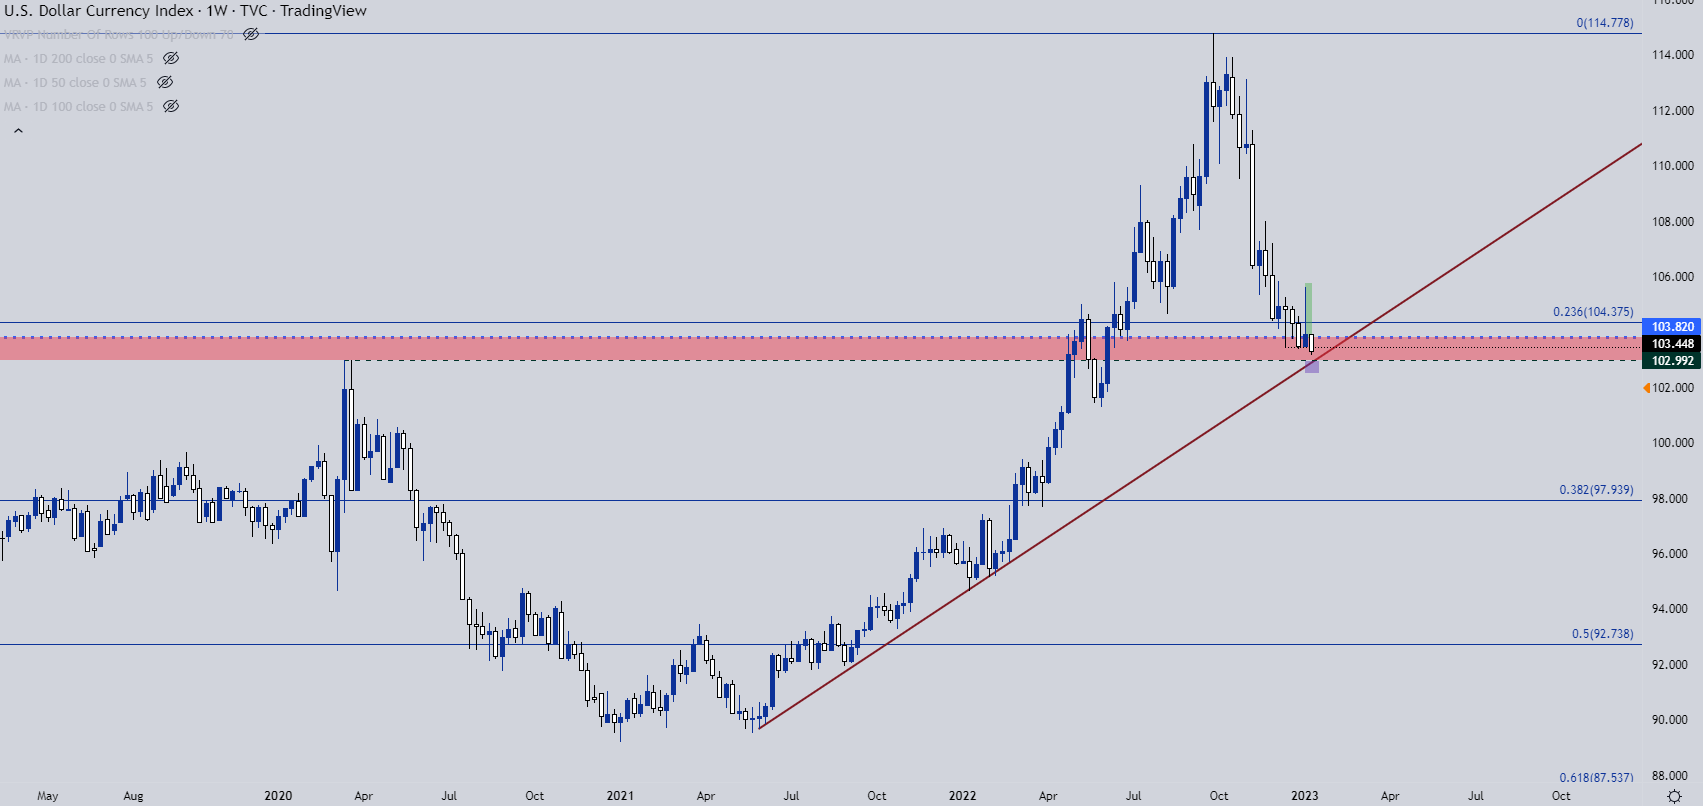
Chart prepared by James Stanley; USD, DXY on Tradingview
US Dollar Scenario Planning
With prices currently testing a fresh six-month-low, the big question is one of continuation. If the weekly bar ends up closing above 103.45, the longer-term picture could start to warm to bullish scenarios, largely on the basis of last week’s inverted hammer holding some element of potential after a support test below those lows was protected.
And given the confluent around the 103.00 level, that will be a major test for the USD. The big driver for this week is the CPI release on Thursday morning but there’s also a litany of Fed-speak, so these themes can also fire on FOMC comments if they’re vociferous enough.
US Dollar Daily Price Chart
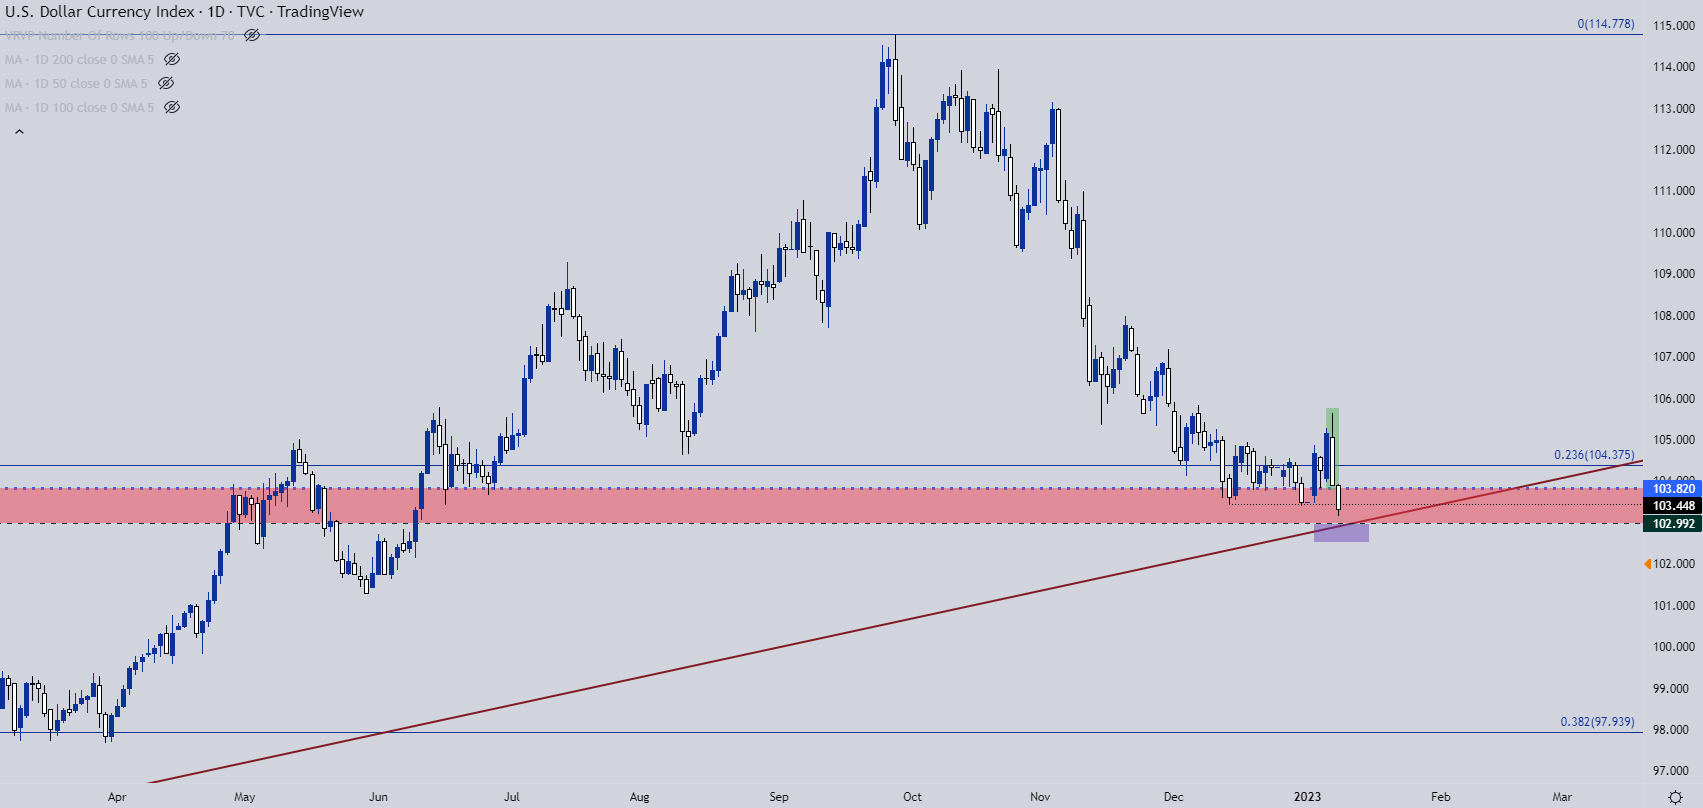
Chart prepared by James Stanley; USD, DXY on Tradingview
— Written by James Stanley
Contact and follow James on Twitter: @JStanleyFX