
US Dollar Talking Points:
Recommended by James Stanley
Get Your Free USD Forecast
The US Dollar sell-off has continued through the first two weeks of 2023 trade. While the USD grasped onto support at 103.45 coming into the year, sellers have continued to push. The heavy drive for the bearish trend re-appeared on the Friday before last, just after the release of some abysmal Services PMI figures that printed at their lowest level since March of 2020. That led to a bearish engulf on the USD daily chart and the following Monday saw sellers break prices down to a fresh low.
Last week saw another rush of weakness for the USD move on Thursday after the release of CPI data out of the United States. The 102 support level came into play the following day, and has since helped to hold the lows through this week’s open and yesterday’s US holiday.
US Dollar Weekly Price Chart
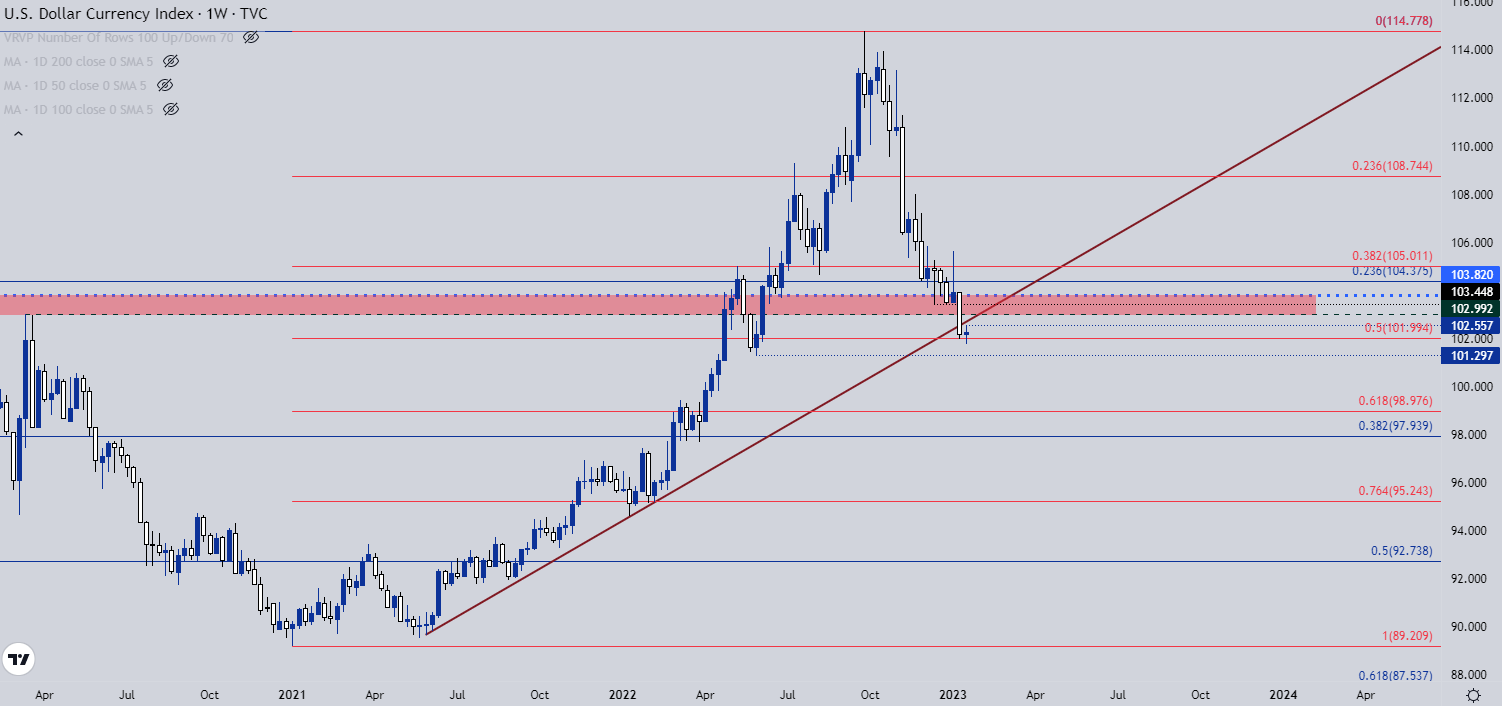
Chart prepared by James Stanley; USD, DXY on Tradingview
US Dollar Shorter-Term
On a shorter-term basis we can see buyers attempting to defend that support level around the 102 handle, even after a quick breach following this week’s open. Resistance is playing-in from the bullish trendline projection, helping to set up a short-term range. A breach of resistance at 102.55 opens the door for a test of prior support as next resistance around the 103.00 handle.
US Dollar Two-Hour Price Chart
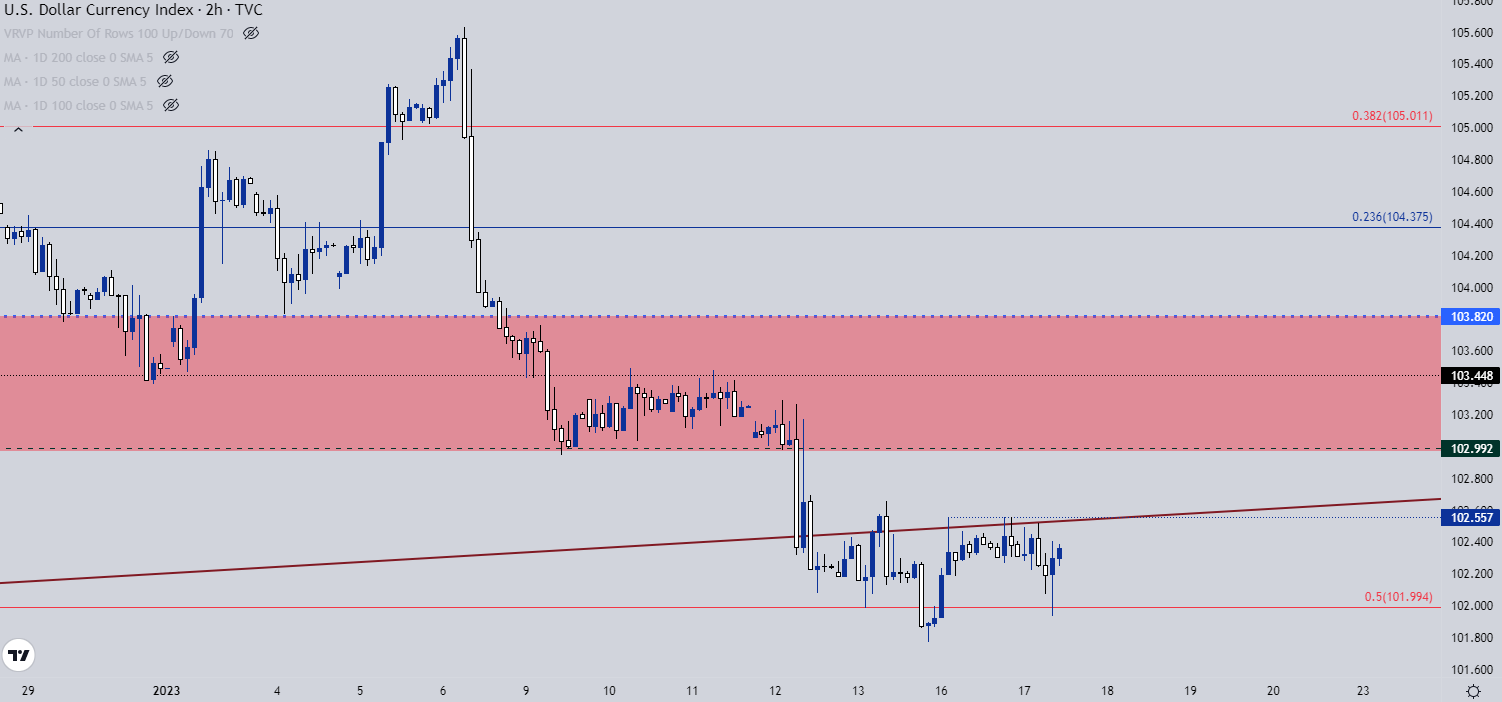
Chart prepared by James Stanley; USD, DXY on Tradingview
EUR/USD Pullback
EUR/USD put in a strong rally after that Services PMI report on the Friday before last. Going into that report, EUR/USD was grasping for support at a trendline projection that was confluent with the 1.0500 psychological level. But, similar to the USD’s bearish engulf after that report was released, EUR/USD printed a bullish engulf and that’s since led to a strong continuation of the rally that saw prices jump each day last week Monday through Thursday.
Since Friday, however, some resistance has started to play-in from around the 1.0869 level. At this point the pullback has been rather restrained, even with sellers showing some pretty rigid defense of that resistance.
This keeps the door open for a larger pullback. There’s support potential around the 1.0750 level and a hold there keeps the door open for bullish trend scenarios. Given how fast the near-term rally developed from 1.0500 up to 1.0869, there’s a few different spots of interest for bullish scenarios below that 1.0750 spot.
EUR/USD Daily Price Chart
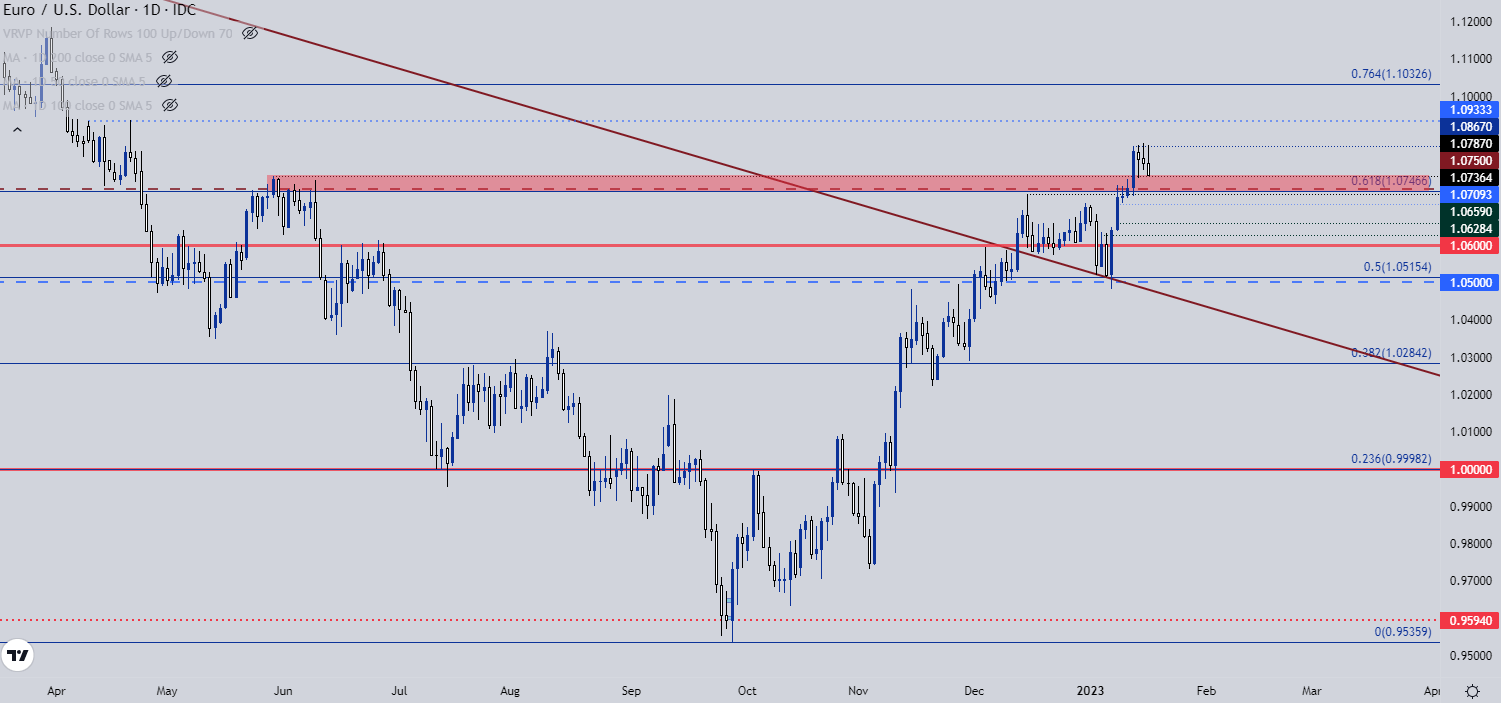
Chart prepared by James Stanley; EURUSD on Tradingview
GBP/USD Fibonacci Resistance
GBP/USD had a rather dramatic Q3 and Q4 of last year. So far in 2023, matters have been a bit calmer, at least on a relative basis.
Prices in GBP/USD have just begun to re-test a major spot on the chart at 1.2303. This is the 50% mark of the 2021-2022 major move – and the 38.2% Fibonacci retracement of that same study is what helped to catch the low two weeks ago at 1.1843. The price of 1.2303 has already elicited a strong reaction when it first came back into play in late-November.
A hold here through today keeps the setup as interesting for swing traders. If price does breach above the Fibonacci level, there’s still resistance potential until the current six-month-high is taken out, around the 1.2450 area on the chart.
GBP/USD Weekly Price Chart
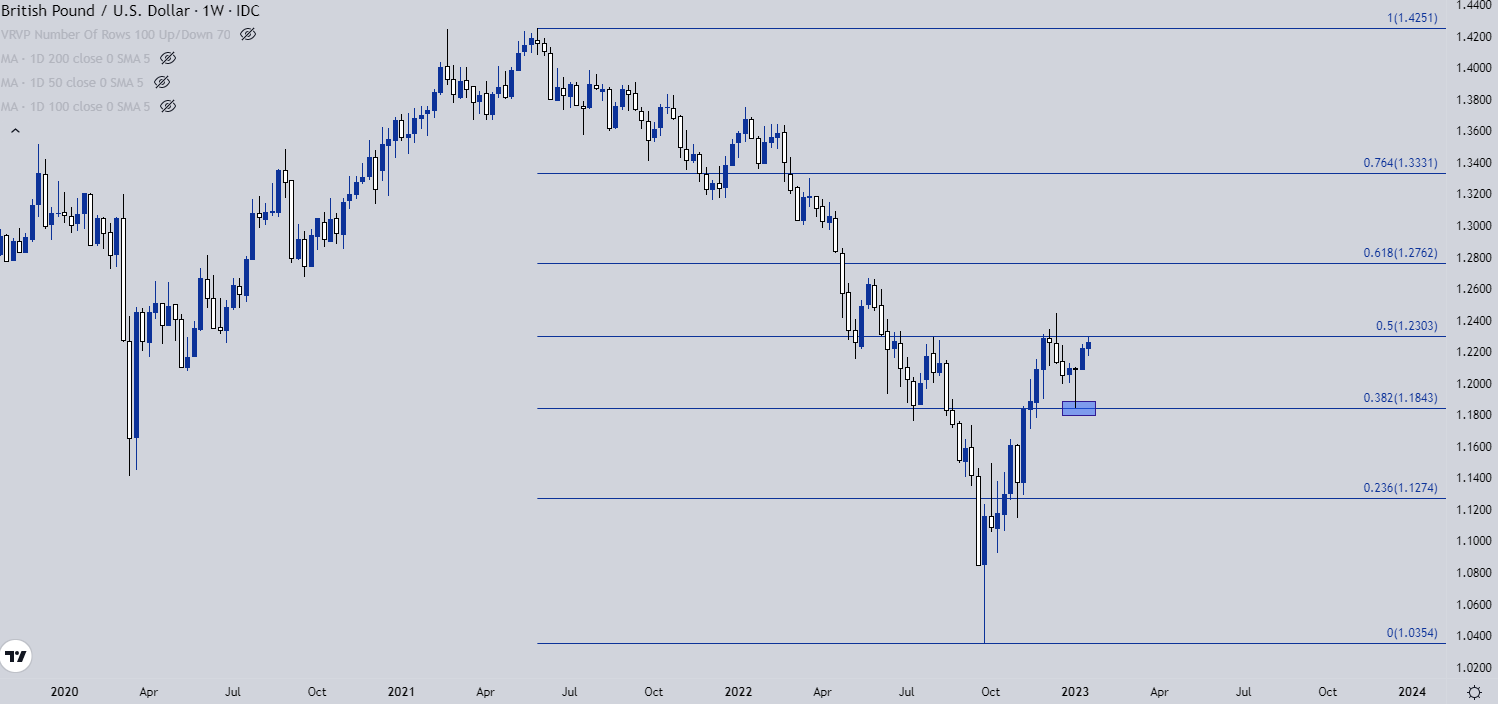
Chart prepared by James Stanley; GBPUSD on Tradingview
USD/JPY
There’s a Bank of Japan rate decision tonight and the attention is on the details, looking for any signs of an impending change from the BoJ and their Yield Curve Control policy.
As much of the world lifted rates to fight inflation last year, the BoJ was the noticeable outlier, keeping rates in negative territory even as inflation scaled up to 40 year highs for Japan. There’s an expected leadership change on the horizon at the BoJ and combined with those surging rates of inflation, the big question is when or how the BoJ might begin to make a move into less-loose policy.
That rate decision is later tonight…
For the part of speculators, their approach has been rather clear. USD/JPY was in a massive bullish trend for 21 months and over the past three months, we’ve seen 50% of that move retraced. This is a clear sign of the massive carry trade that had built in the pair continuing to unwind as there’s both a weaker USD on the back of lower US rates and Yen-strength on the back of what’s, in essence, a short squeeze in JPY.
The bigger question here is one of timing as the trend has clearly turned: If the BoJ avoid the topic altogether tonight, logically giving bulls some breadcrumbs to follow, for how long might that bullish trend continue? It seems at this point that any bullish flares would be a pullback in a bearish trend, at least until something else shifts around US rates. This opens the door for items like lower-high resistance potential around 130 or 131.25.
Recommended by James Stanley
Get Your Free Top Trading Opportunities Forecast
USD/JPY Weekly Chart
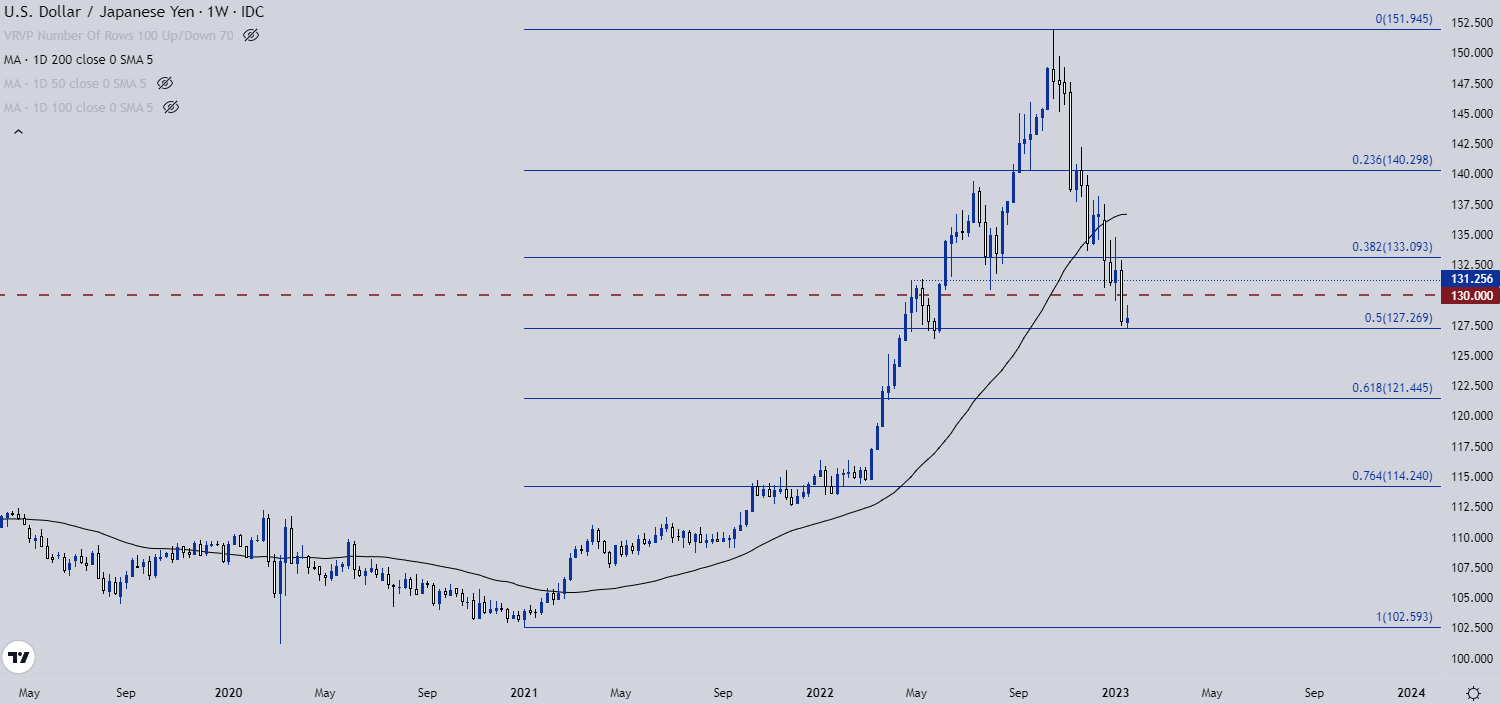
Chart prepared by James Stanley; USDJPY on Tradingview
— Written by James Stanley
Contact and follow James on Twitter: @JStanleyFX