
US Dollar Talking Points:
- USD strength is showing up today as DXY is testing a breakout above the 105.00 level.
- This morning’s ADP numbers gave a boost to the Greenback but tomorrow’s NFP report may be more impactful as intense focus will be paid to the Average Hourly Earnings (AHE) component for signs of wage growth and the unemployment rate for signs of impact to the labor market from the Fed’s brisk pace of rate hikes last year.
- The analysis contained in article relies on price action and chart formations. To learn more about price action or chart patterns, check out our DailyFX Education section.
Recommended by James Stanley
Get Your Free USD Forecast
The US Dollar is testing a breakout this morning after a continued grind in a support zone that held the lows through the second half of December. I looked into this support on Tuesday just as the USD was starting to show some bullish lean, and this started from the simple fact of price stopping the breakdown after an aggressive sell-off enveloped the currency in Q4.
US Dollar support is holding at a zone of prior resistance, taken from swing highs that were set in 2017 and 2020. To be more exact, the low from mid-December printed at 103.45 and this same price was in-play to finish the year.
US Dollar Weekly Price Chart
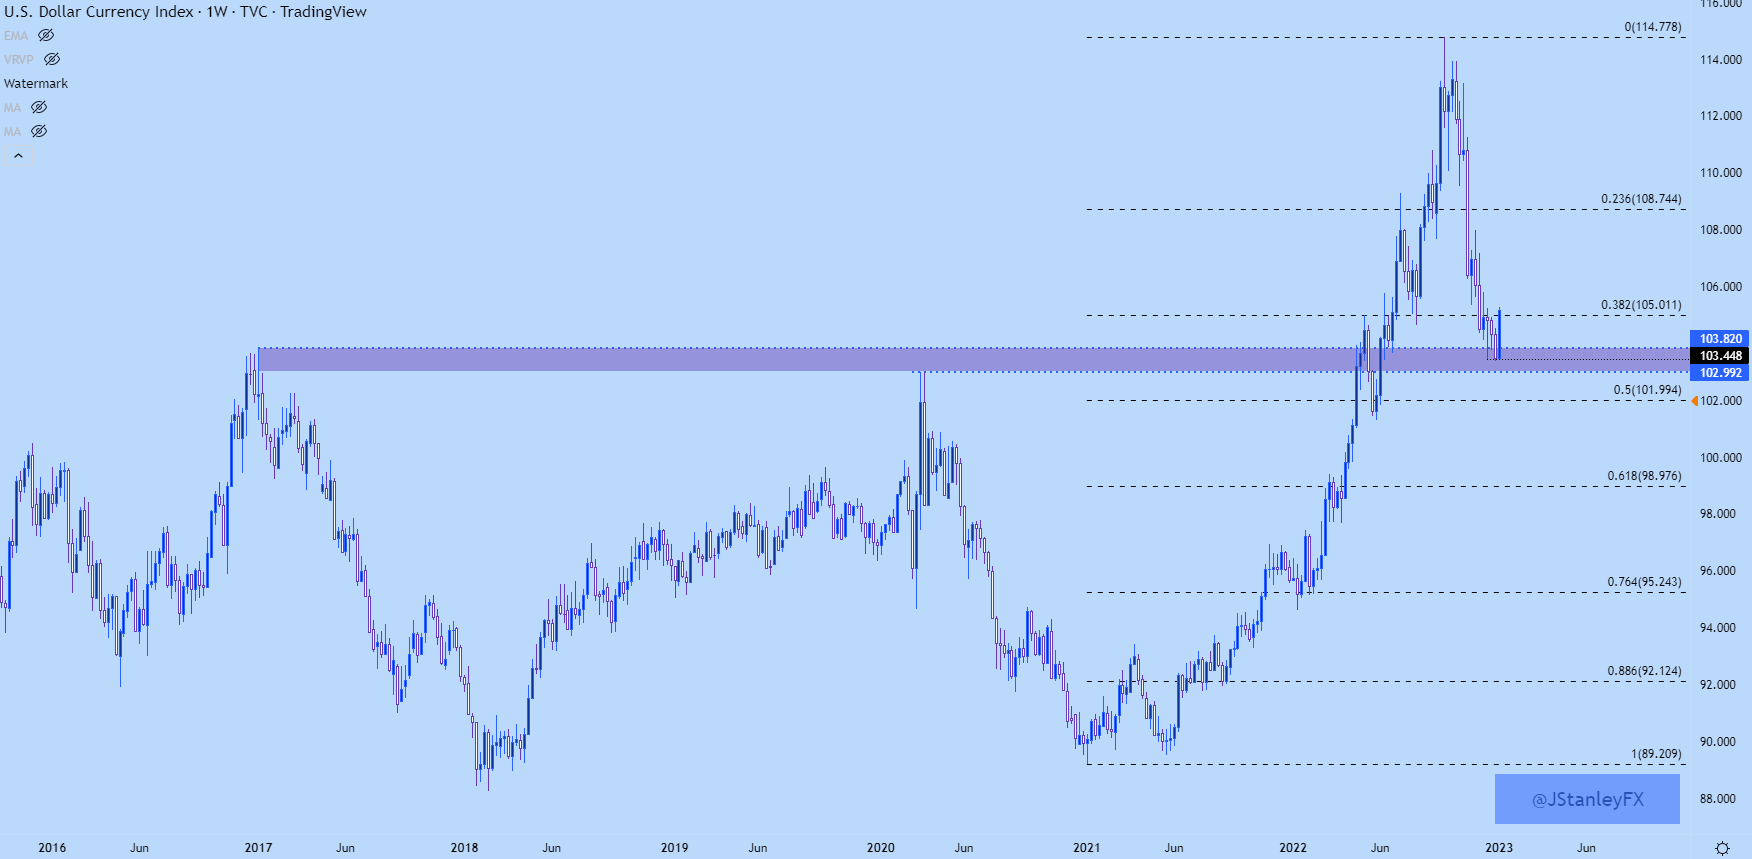
Chart prepared by James Stanley; USD, DXY on Tradingview
USD Testing Short-Term Range Breakout
That support zone started to come into play in mid-December after a couple of important drivers. First was the CPI print on December 13th, which helped to set a reversal in stocks. In the USD, price pushed down towards this support and that move continued the day after through the FOMC rate decision.
After that, and for the next two weeks into the end of the year, the USD ranged between well-defined support and resistance. The resistance side of the matter was marked by Fibonacci levels at 104.70 and 105.01 and bulls are finally starting to make a move this morning, pushing price back-above the 105.00 level for the first time since the December CPI print.
This raises the prospect of bigger-picture reversal potential after the steep slide that the USD was on through most of Q4, until that support finally started to come into play.
Recommended by James Stanley
Building Confidence in Trading
US Dollar Four-Hour Chart
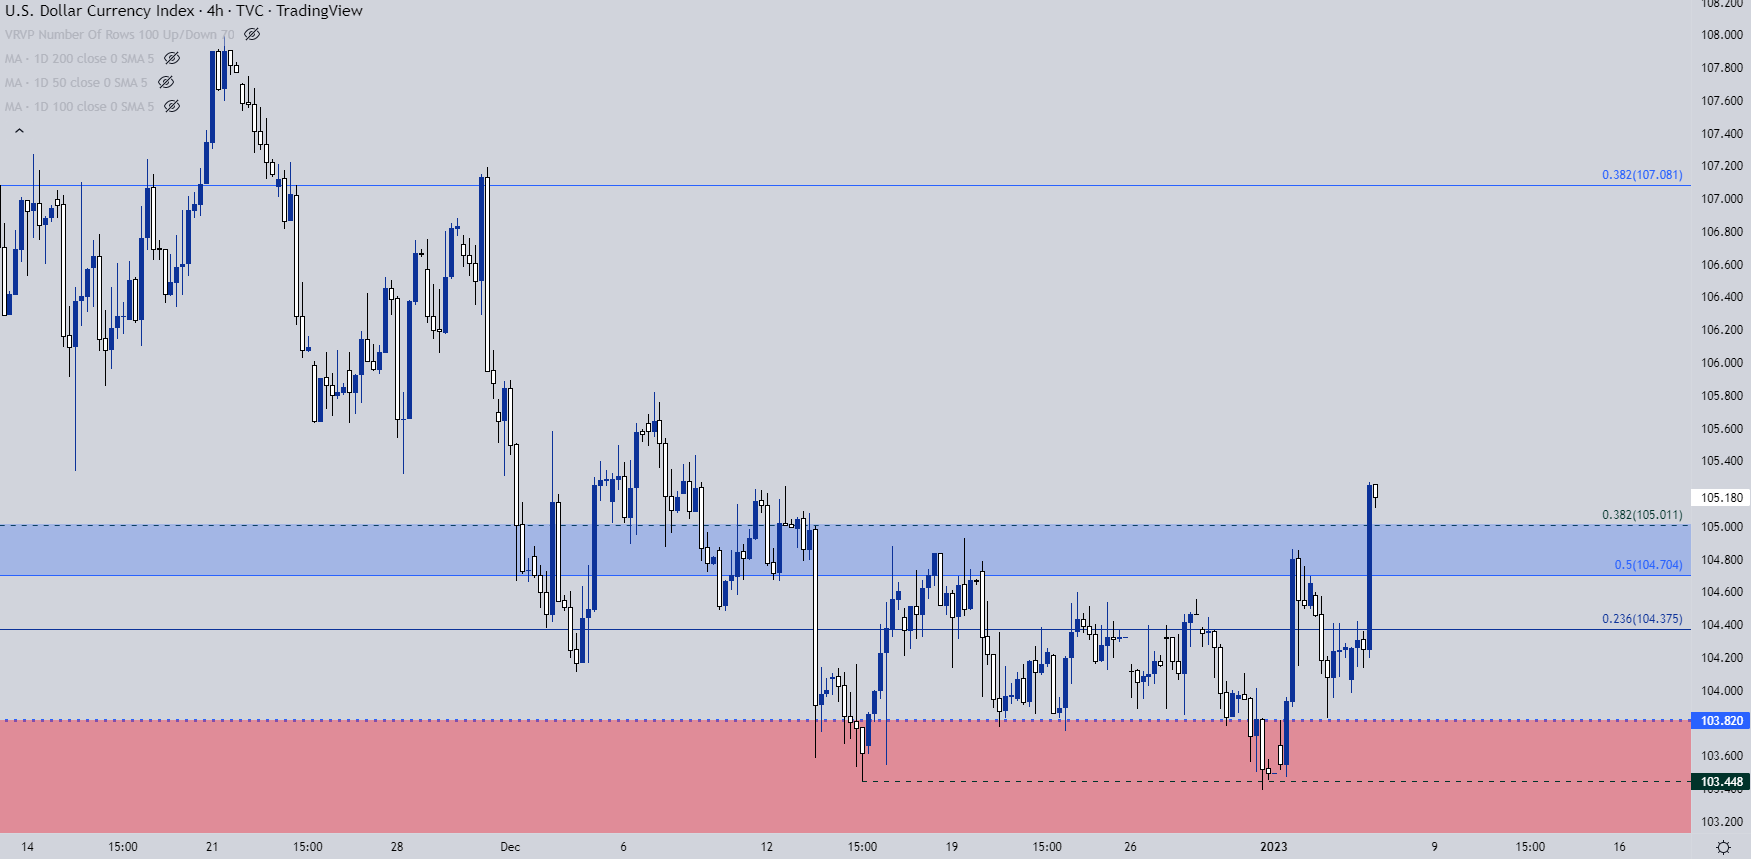
Chart prepared by James Stanley; USD, DXY on Tradingview
EUR/USD: Lower-Lows and Highs, back to the Trendline
EUR/USD started off the year with something new: A lower-low. Prices on the daily chart stuck to a consistent stream of higher-highs and higher-lows through all of Q4. On Tuesday, prices breached prior range support to set a fresh lower-low and the subsequent bounce was caught right at 1.0636, which was the swing low from March of 2020.
That support on Tuesday showed up at an interesting spot, a trendline that had previously held as resistance, taken from June 2021 and February 2022 swing-highs. That projection is working on support again for a second time this week, illustrating a more aggressive bearish push which also speaks to USD’s upside potential given the recent breakout.
If the breakout in USD is going to take, it’s going to need some help from EUR/USD and the next major spot of support in EUR/USD is the 1.0500 psychological level. Lower-high resistance potential remains at prior support, from around the Fibonacci level at 1.0579 up to the 1.0600 psychological level.
Recommended by James Stanley
How to Trade EUR/USD
EUR/USD Four-Hour Chart
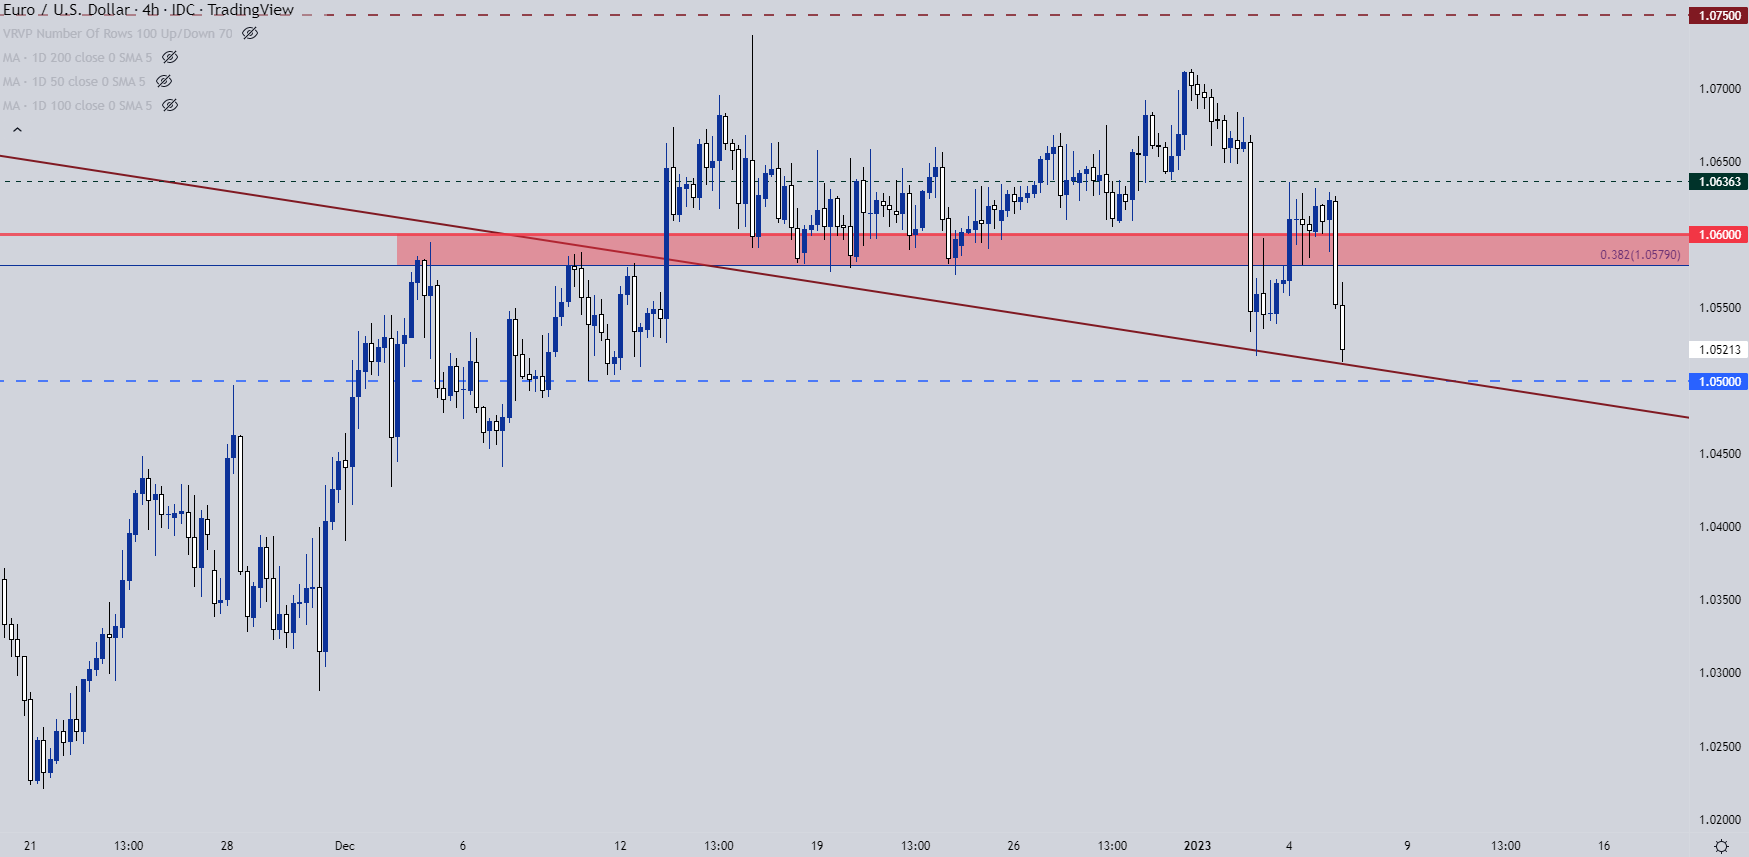
Chart prepared by James Stanley; EURUSD on Tradingview
GBP/USD
Cable appears to be a bit more developed for reversal scenarios at this point but there’s some very similar dynamics to the above in EUR/USD.
The fight for this week in GBP/USD has been at the 1.2000 handle. This price came back into play to help hold the lows into year-end; but buyers weren’t able to do much above the 1.2100 handle and already in the New Year, bears were able to force a break-below the big figure.
But turns take time and this scenario is still in the process of working. There’s a Fibonacci retracement level at 1.1843 and if bears can test through this in due course, there’ll be a more-convincing argument behind bigger-picture reversal scenarios in the pair.
GBP/USD Daily Price Chart
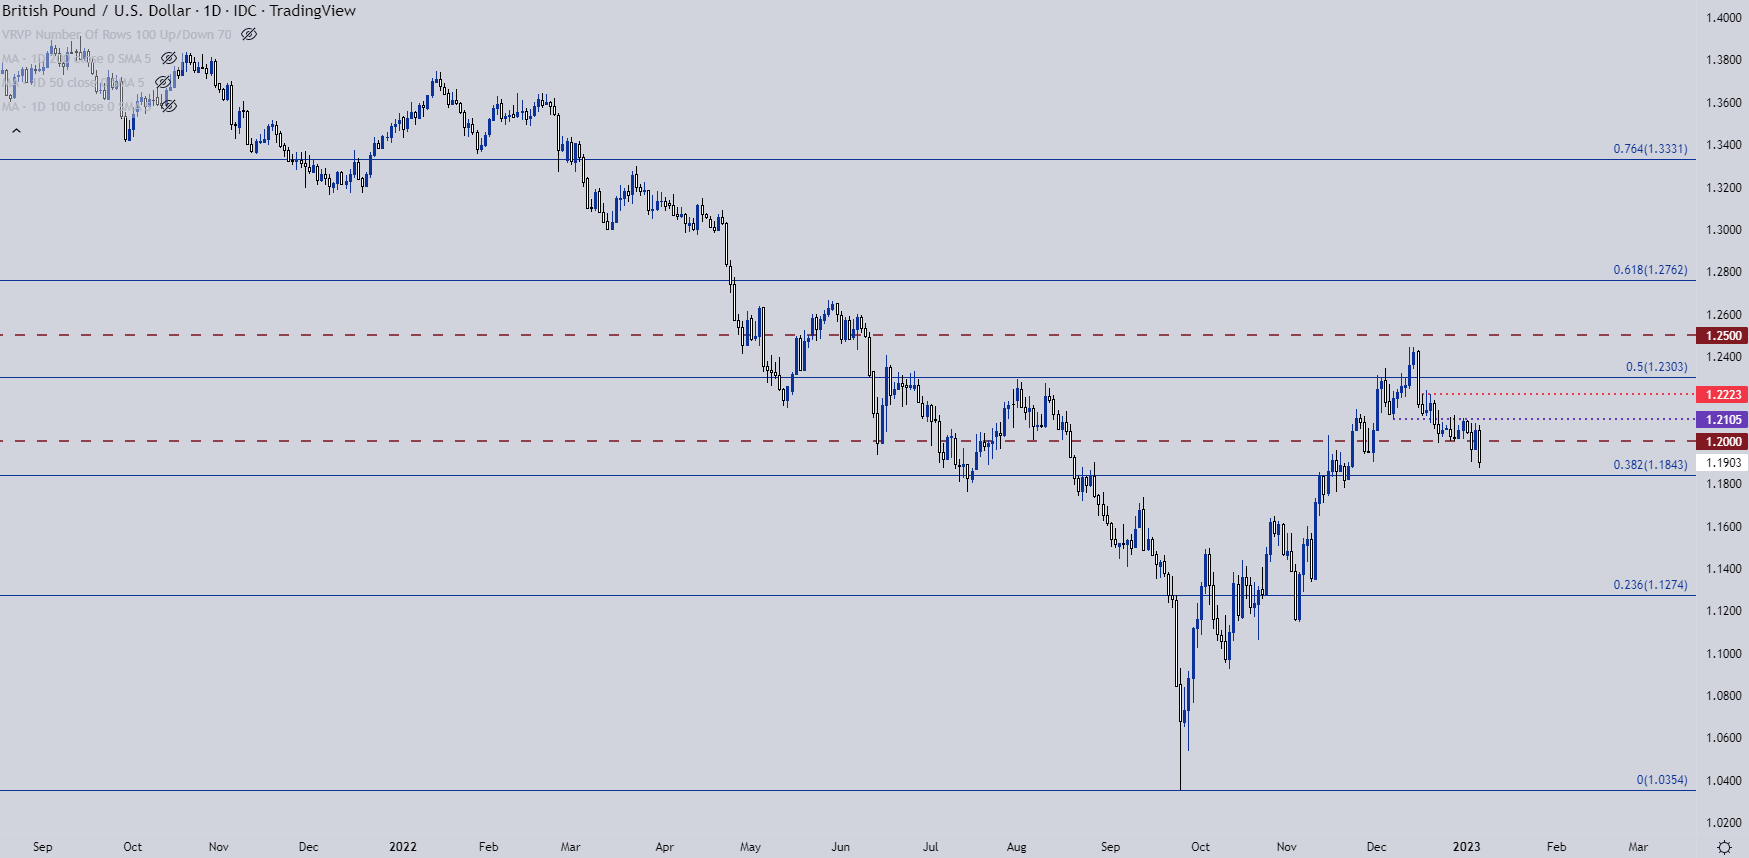
Chart prepared by James Stanley; GBPUSD on Tradingview
USD/CAD Shifting Tides
Through much of December USD/CAD looked like one of the more attractive pairs for USD-strength scenarios. This was largely due to CAD-weakness, but that theme looks to be shifting. Even as the USD is breaking out to a fresh high, USD/CAD is merely pushing up to a lower-high.
Now, that’s not to say that a bigger reversal doesn’t take place here but, if looking for USD strength, tracking one of the breakouts above in either EUR/USD or GBP/USD looks to be a more attractive way of going about that.
Where USD/CAD could hold some interest at this point is for bearish USD reversal scenarios and the possible lower-high works with that scenario. Right now prices are finding resistance at a spot of prior short-term support, plotted at 1.3579.
USD/CAD Daily Price Chart
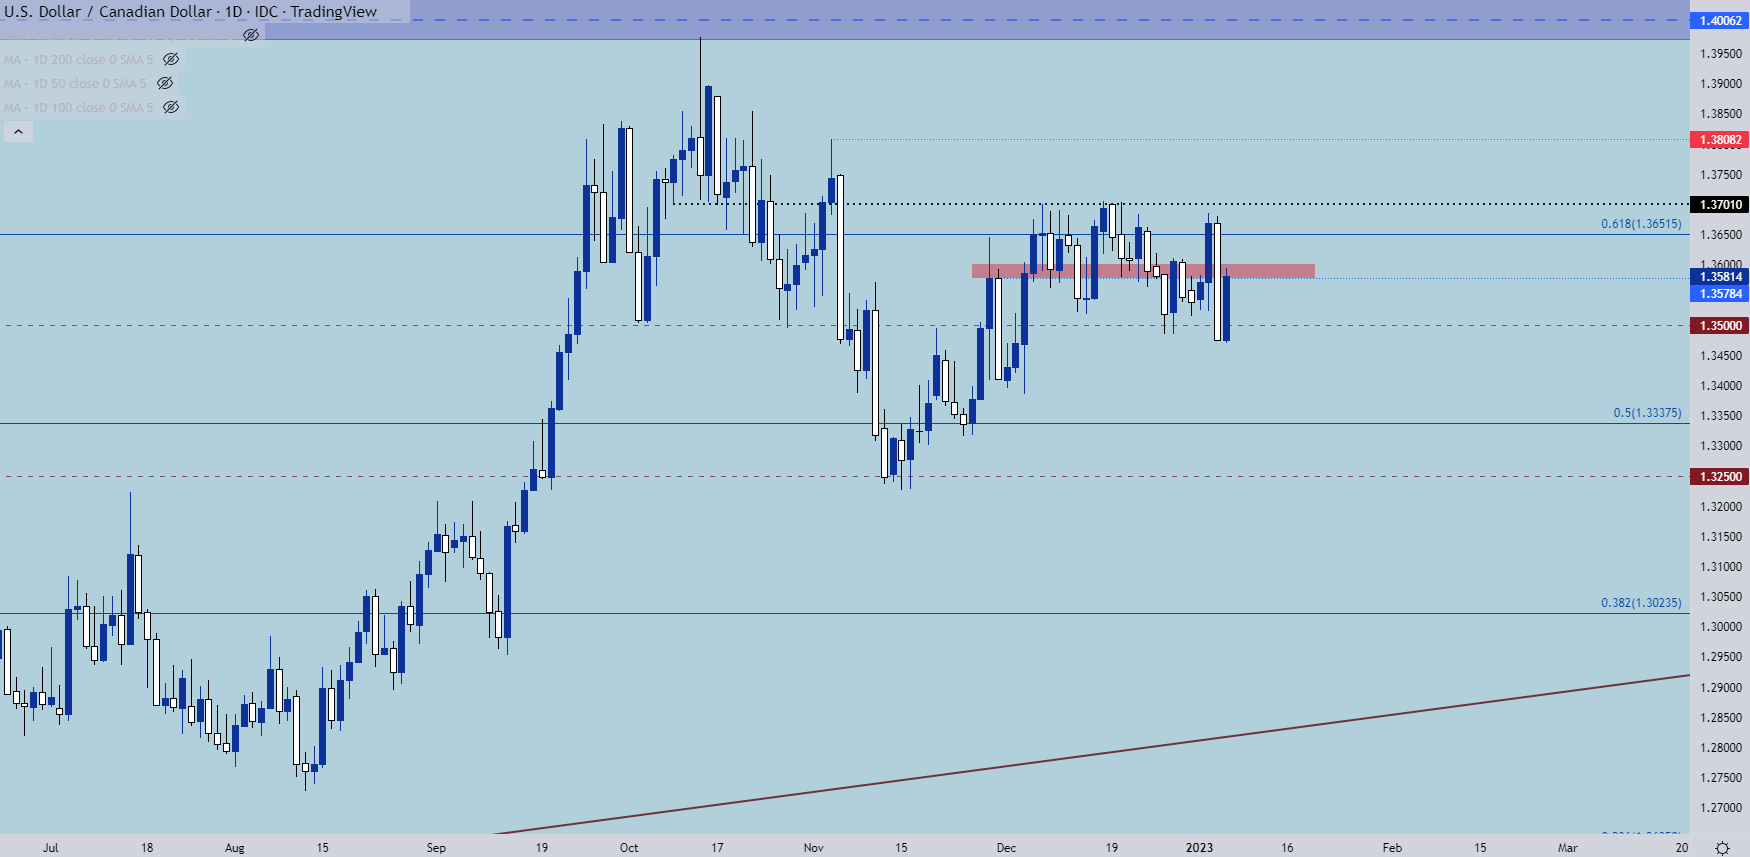
Chart prepared by James Stanley; USDCAD on Tradingview
USD/JPY
When I looked into USD/JPY on Tuesday prices had just started to re-test the 130 psychological level. That’s since led to a spirited bounce, with prices surging through the first two spots of resistance at 131.25 and 132.33. There’s one more spot sitting over head at an area of support-turned-resistance and that’s at 134.45.
There’s still a case to be made for down-trending potential but the big question really goes right back to the very first market we looked at in this report of the USD. If the US Dollar is working on a big picture bottom, USD/JPY can continue to run-higher. Continuation potential, however, is likely going to be determined by hints around the BoJ for any potential shifts to policy.
I think Yen-strength could have some run this year as the BoJ is now facing 40-year highs for inflation and an expected leadership change in a few months. But I’d much rather look for that Yen-strength theme elsewhere, such as against the Euro or British Pound. I discussed this at-length in yesterday’s Japanese Yen Price Action Setups article and below we can see greater development in the bullish USD/JPY theme.
Price has now broken above a falling wedge formation, often approached with the aim of bullish reversals, keeping the door open for topside continuation potential. Support potential now exists at 132.33 and 131.25; with the next spot for bulls to challenge sitting overhead at 134.45.
Recommended by James Stanley
Get Your Free Top Trading Opportunities Forecast
USD/JPY Four-Hour Chart
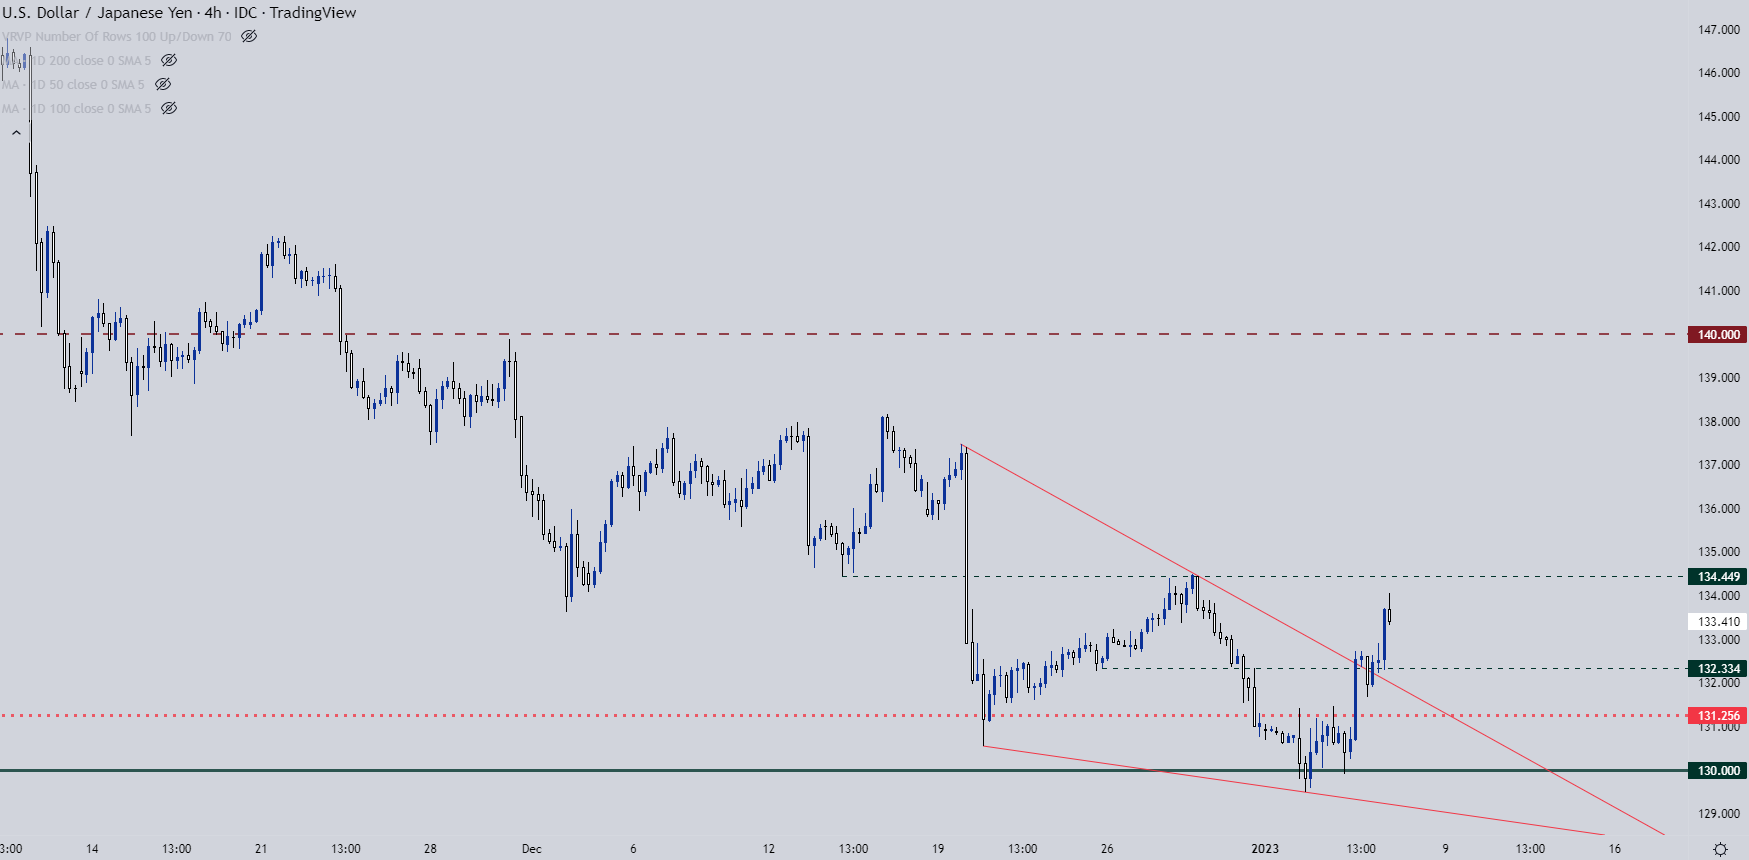
Chart prepared by James Stanley; USDJPY on Tradingview
— Written by James Stanley
Contact and follow James on Twitter: @JStanleyFX