
Hey, Traders!! Welcome to the article about The Mars EA!!´ll spare you the bullshits, about Unique, Secret, Artificial, etc… The Mars is an Ea that trades against retail, especially against Break out traders. I will try to describe the trading logic and functions of this system, so you can use it effectively with my settings or build your own portfolios too. I have added multiple back-tests with a wide range of the settings on the 99.9% tick data at the bottom of the article, you will as well find their excel tab so you can easily decide by yourself how to use the EA and if this risk to reward is worth it for you. But I suggest doing your own back-tests with proper data. How to do it is in this blog post.
I’m sure that every one of us has ever tried manual trading. We all bought some trading books in the beginning or spend money on some trading courses, where mostly the same rubbish is taught. 95% of authors who wrote the books, are great teachers and very good at explaining on charts what already happened, showing here what you should buy and where you sell. Easy :), isn´t it?
Well, if it’s as simple as in the books, then we all would be billionaires already. Markets and especially the Forex market are highly manipulated by large speculators and driven by central bankers’ IPDA (Interbank Price Delivery Algo). Currencies are the products of central banks, and they dictate the price, no matter how much any groups buy or sell. IPDA deliver price where it’s needed and where it does business. IPDA is constantly seeking liquidity which can be in the form of stop losses of retail traders. That is actually great because by understanding retail traders’ behaviour we know where the liquidity is and where the IPDA will most likely take the price next. The worst entries to the markets mostly have break-out traders and that’s what The Mars EA trades against with a little help from the grid.
How is liquidity created?
I have highlighted the levels where are mostly the breakout traders entering the markets and mainly where they place their stop orders. (Markets Structure Picture Below)
1) Break of the consolidations, break out traders entering the market and they put their SL below the last swing low.
2) After the price breaks and pullbacks back to the old high. Another group of traders is entering with SL bellow swing lows as they learned in the books.
3) Break of the old high, brings another group of traders who are entering the third wave again. They put stops below the latest or previous swing low.
4) Totally worst entry has FOMO traders who see the market flying and they want to catch it, these mostly enter on the top/bottom of the mean reversal.
This behaviour of the traders which places their stops to similar zones below swing lows creates stop loss cluster = Liquidity. Now Large speculators are not looking for our stops, because they would like to destroy us, but they need to fill the order. Now think about it this way, stop losses of buyers is actually a sell stop. Large speculators need someone to sell so they can buy, that’s why the price very often drops to these liquidity zones before the expansion move and that’s the market movements in which The Mars EA wants to participate with multiple positions and targets to the liquidity zone.

As you can see two breakouts with new highs induced 3 groups of traders to enter the market, but they are entering late or too early (before the liquidity loaded). This is a disadvantage of break-out trading. I don’t say it’s not working. But mostly if break out is close to the daily ATR high/low levels it’s fake. And trading against break-out systems gives more probabilities and profitability in long term. The Mars EA takes these advantages with multiple independent grid sequences of orders to target the groups’ Break out systems.
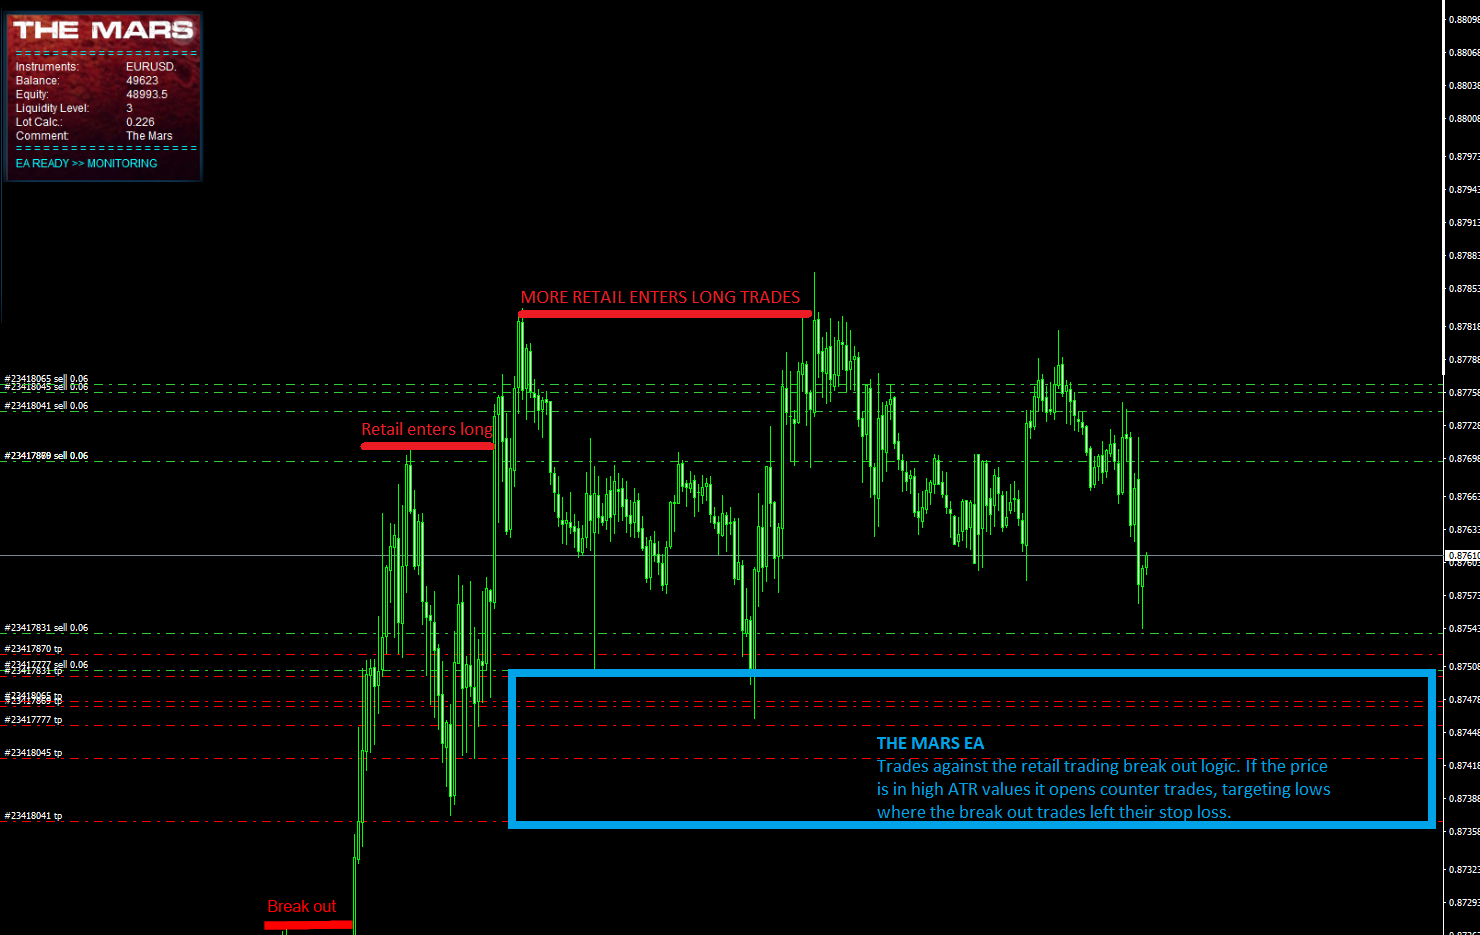
Trades example in Metatrader
In the picture below you can see how the EA is placing the trades once the price breaks new highs in the overbought conditions above the daily ATR and in the pre-determined liquidity levels. Which we can adjust in the EA settings. For better understanding, I recommend running visual backrests.
Liquidity Entry Levels
As already mentioned, The Mars EA trades against the breakout traders, but it has to be in oversold /overbought conditions which are filtered by the ATR and mainly by the IPDA ranges 60 trading days back in the levels — Previous Day’s H/L, Previous Weeks H/L, Previous Months H/L and its equilibriums adjusted to the NY time. Because the new day starts at NY Midnight time and not as what most MT4 brokers has as their daily close. By re-adjusting this we get completely different views to the market, but you don’t have to worry about this and your broker time, its coded in the system. Important thing to understand here is following trading logic, which I will explain on bullish market structure (Same logic applies to bearish scenario)
More waves of break out, means more inducements and more traders in the markets means bigger stop loss clusters (liquidity) bellow swing lows. We know that after inducement the manipulation will most likely come, but FX market is not centralized and as we don’t know if the volume in stop loss clusters is already big enough for large speculators to fill their orders. We can speculate that manipulation will start on specific levels, but we really never know when. Thats why the EA employs the sequences of trades in the grid to average our entry and diversify the targets. We do not want to have just a stupid grid that adds positions with some predefined pips gaps so we can set the efficiency of the EA for entering on specific liquidity levels. Which gives different probabilities and accuracy as you can see in the variable 10 years back tests. Note: this is the Grid / Martin EA it can have large DD.
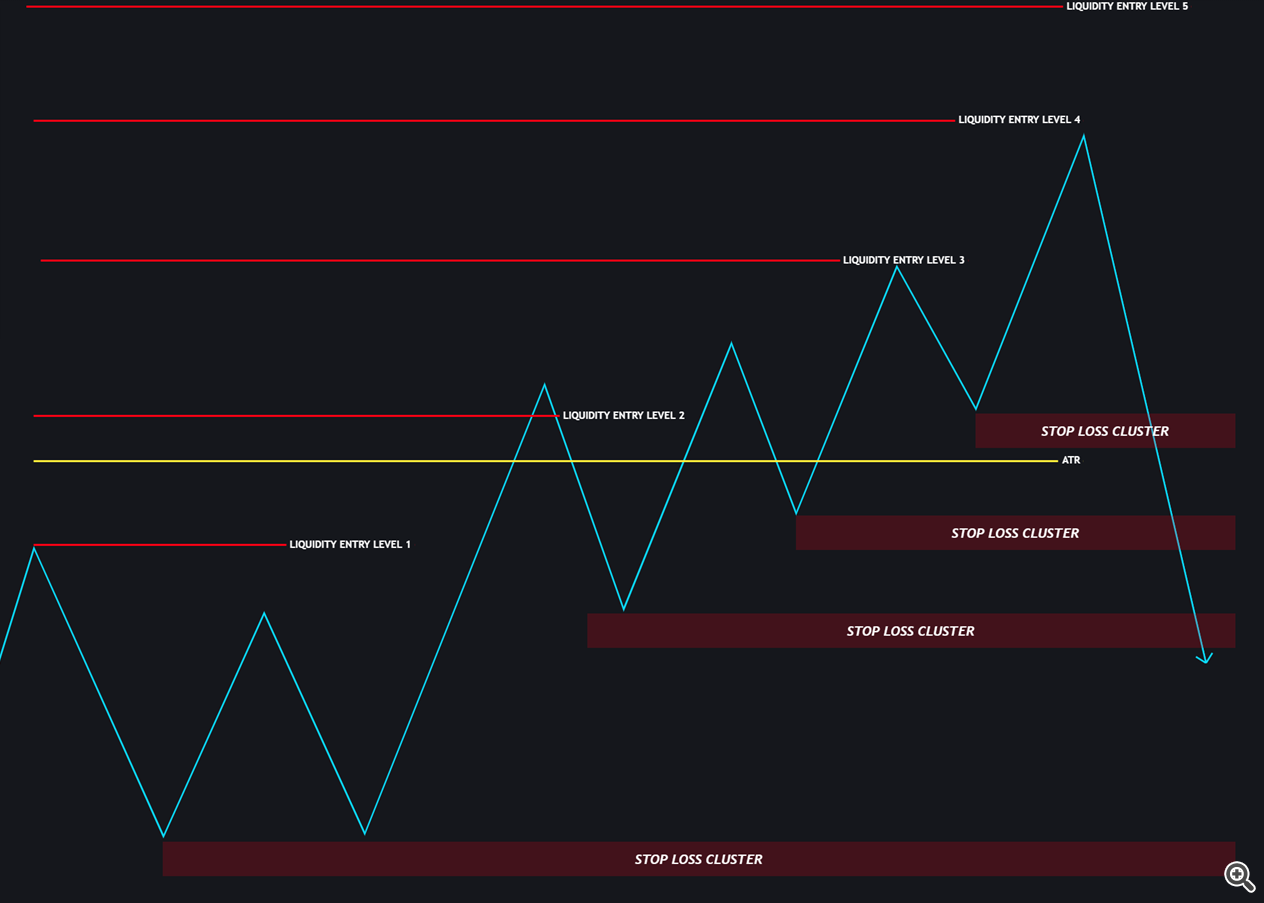
Liquidity Entry Levels Logic
1) High Liquidity level – Better accuracy, Fewer trades, Less drawdown
2) Low Liquidity level – More trades, higher drawdown, Less accuracy
EA trades only from the Liquidity levels 3, its implemented in the predefined settings, but just for the explanation
Liquidity Entry Level 1 – The level where first countertrend traders entering, market can start reversing from here but mostly it’s too early
Liquidity Entry Level 2 – slightly below daily H/L, it gives more trades but still its less accurate, we skip this one as well
Liquidity Entry Level 3 – slightly above daily ATR and Standard deviation – the best entry oversold / overbought conditions
Liquidity Entry Level 4 – higher above daily ATR and with these settings. This offers very few trades on our commodity portfolios
Liquidity Entry Level 5 – gives almost no trades
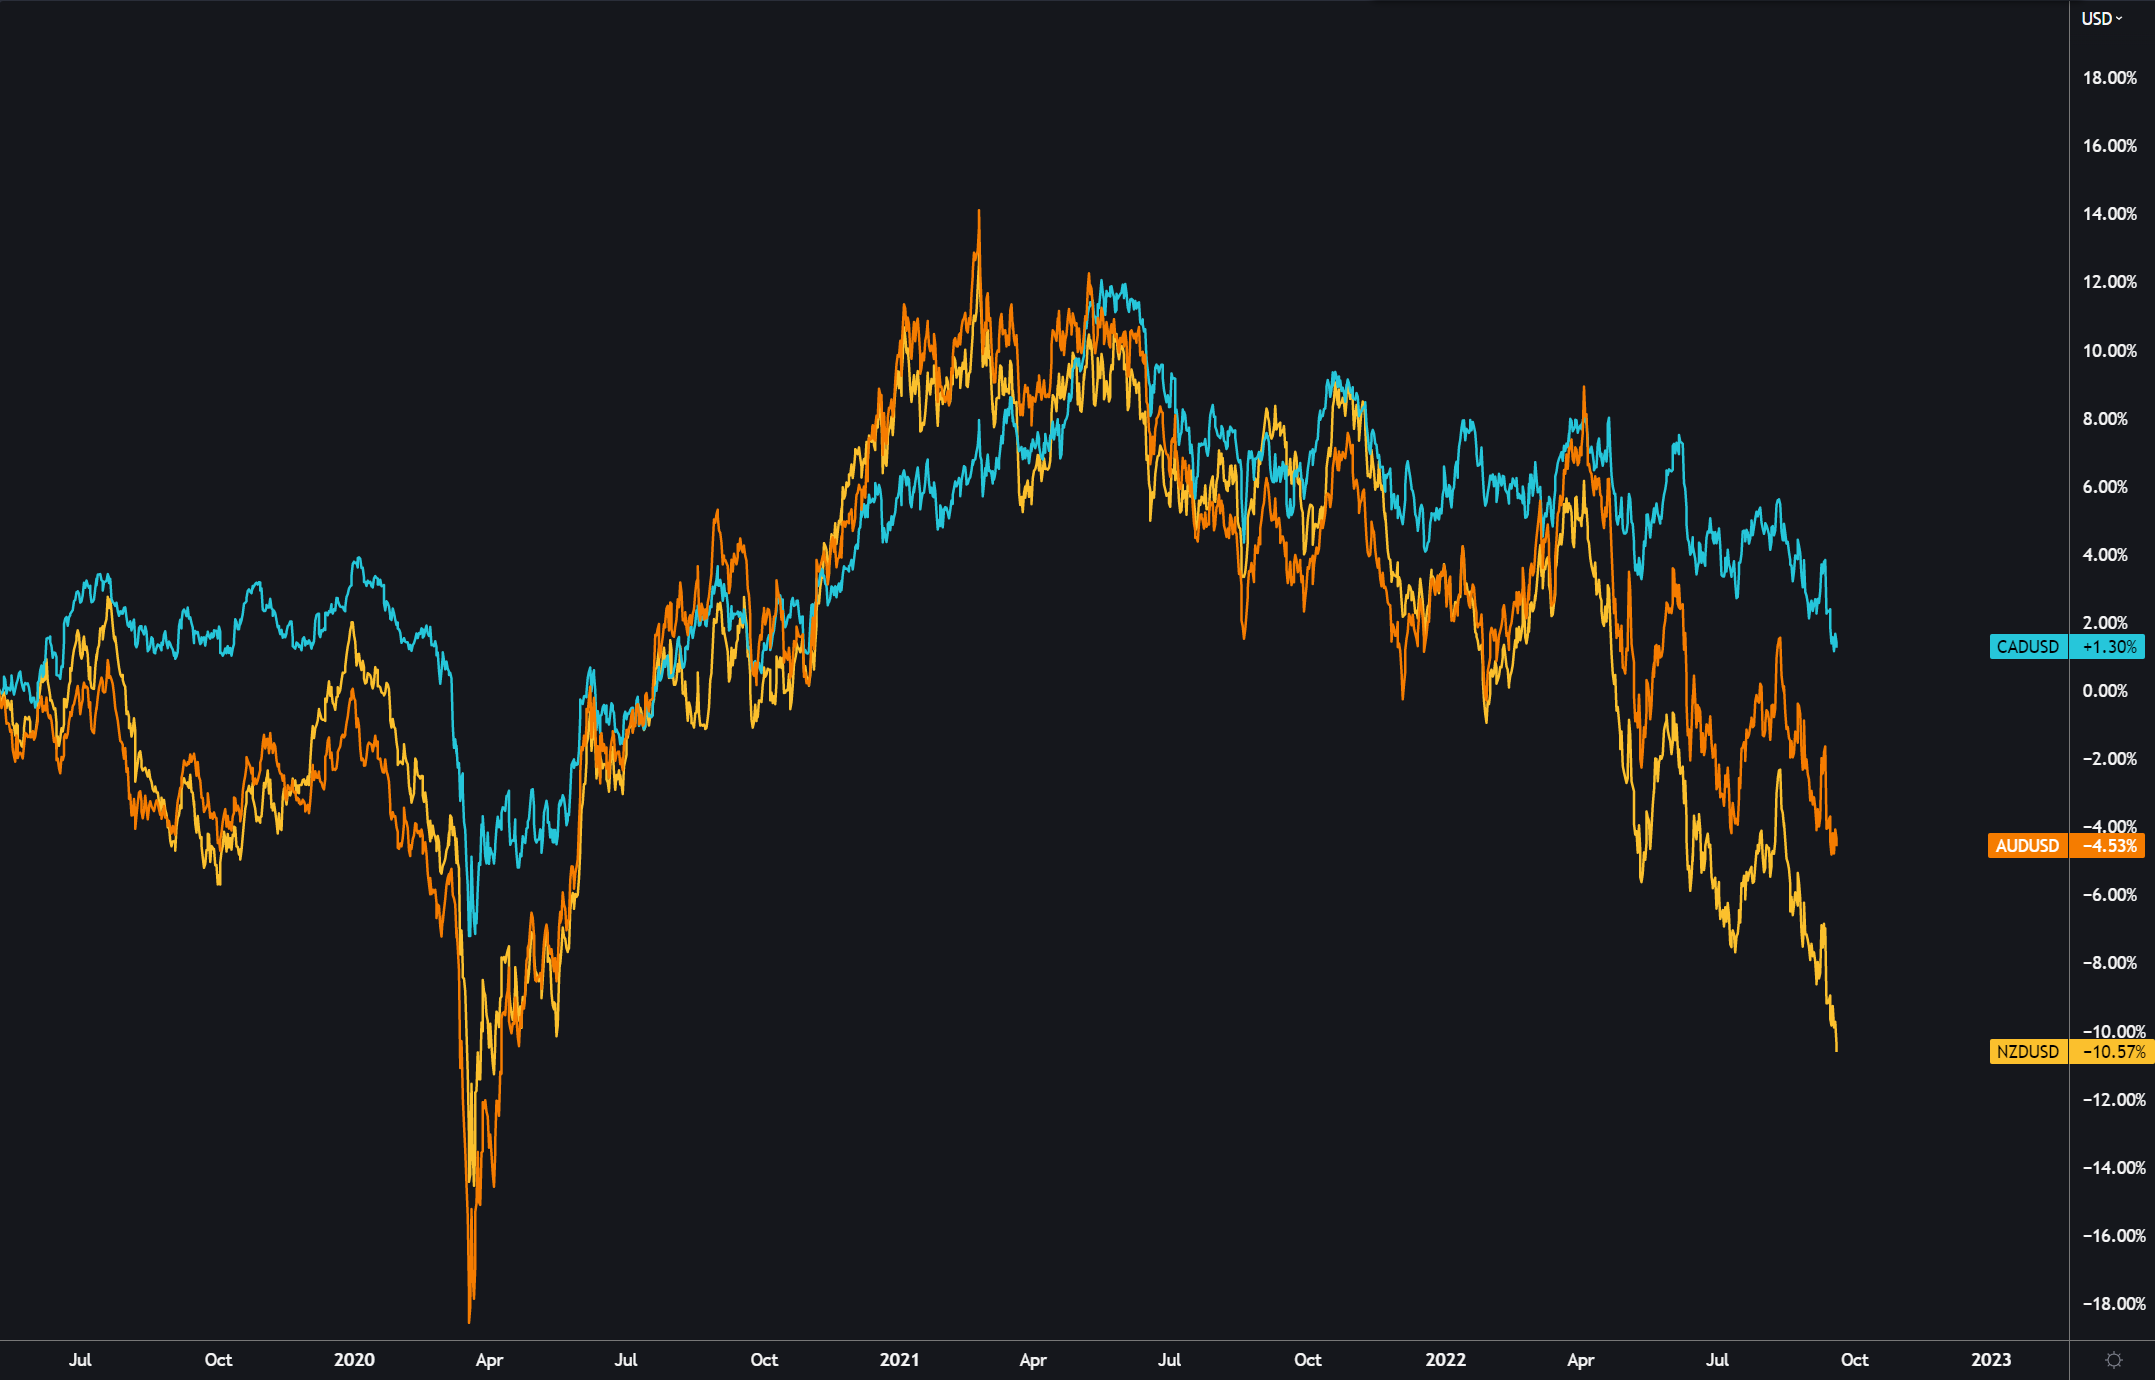
Commodity Portfolio
The Mars is very flexible system that can trade on most of the FX pairs, but the most stability it delivers on the commodity pairs triangle AUD/NZD/CAD. These three correlates together (see picture below). There are only few situations during the year when some of the currency move faster than other against the USD. But these commodity pairs always go together. So basically, trading just triangle of these three – AUDNZD, AUDCAD, NZDCAD is enough to be profitable with relatively low risk and make stable gains every month with minimum capital $1000. You can check 👉 THE MARS EA LOW RISK performance on approx. $10K USD account. Same % gains with low risk are possible to achieve with $3000 account. Commodity portfolio can be traded on $500 with special settings (shared on the bottom) but it’s High-Risk trading as I run here 👉 THE MARS HIGH RISK. Another results can be found here – Trader’s profile (mql5.com)
I do now want give financial advice, but if you dont have at least 5K capital, you should better use cent account, EA will serve you much better due to the more precize lot sizing and faster accumulation of profits. Better on the cent than on classic account where you must run high risk especially if you want to use full potential of the EA.
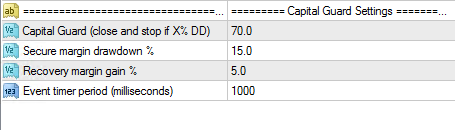
Capital Guard
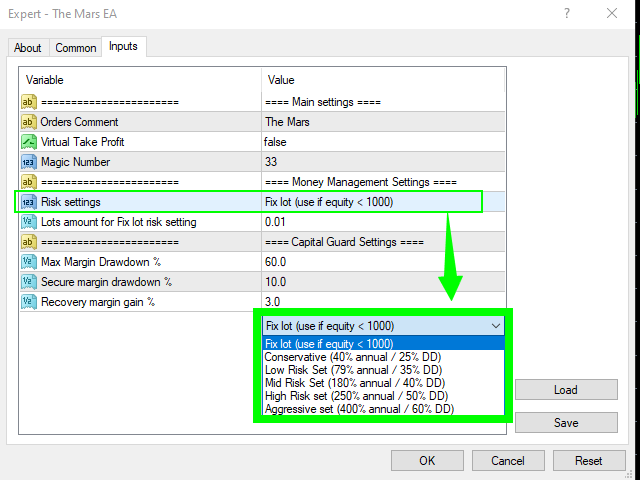
For securing our accounts I have implement capital guard protections, which has couple settings that doesn’t allow to happen drawdown on all the pairs at the same moment or it close all positions and stop trading when X% DD occurs in case of the black swan event.
Capital Guard (close and stop if X%DD) – 70 – If the value of 70 %DD is reached the EA will close all trades and stop trading
Secure margin drawdown – 15 if the value of 15 %DD is reached the EA will not start trading on other pairs where the sequences of trades are not open yet until the %DD drops back to the value of Recovery margin gain which 3rd settings in capital guard
Recovery margin gain % – 5 – value of the drawdown when the EA opens the trades on all pairs trading was blocked by secured margin before.
Event Timer Period (milliseconds) – 1000 – specifies how often the EA should check the account
In December 2022 – AUDNZD has crashed over 800 pips without pullback. Yes this situations are dangerous for this EA. On the equity below you can see how the EA closed loss lower then 30%. Capital guard settings is up to you. But have on your mind that if you loose more then 50% than you need 100% gain to recover. I feel comfortable to close 30% loss and start over. It will most likely recover in few months. Yes its painful but better than loose capital completely.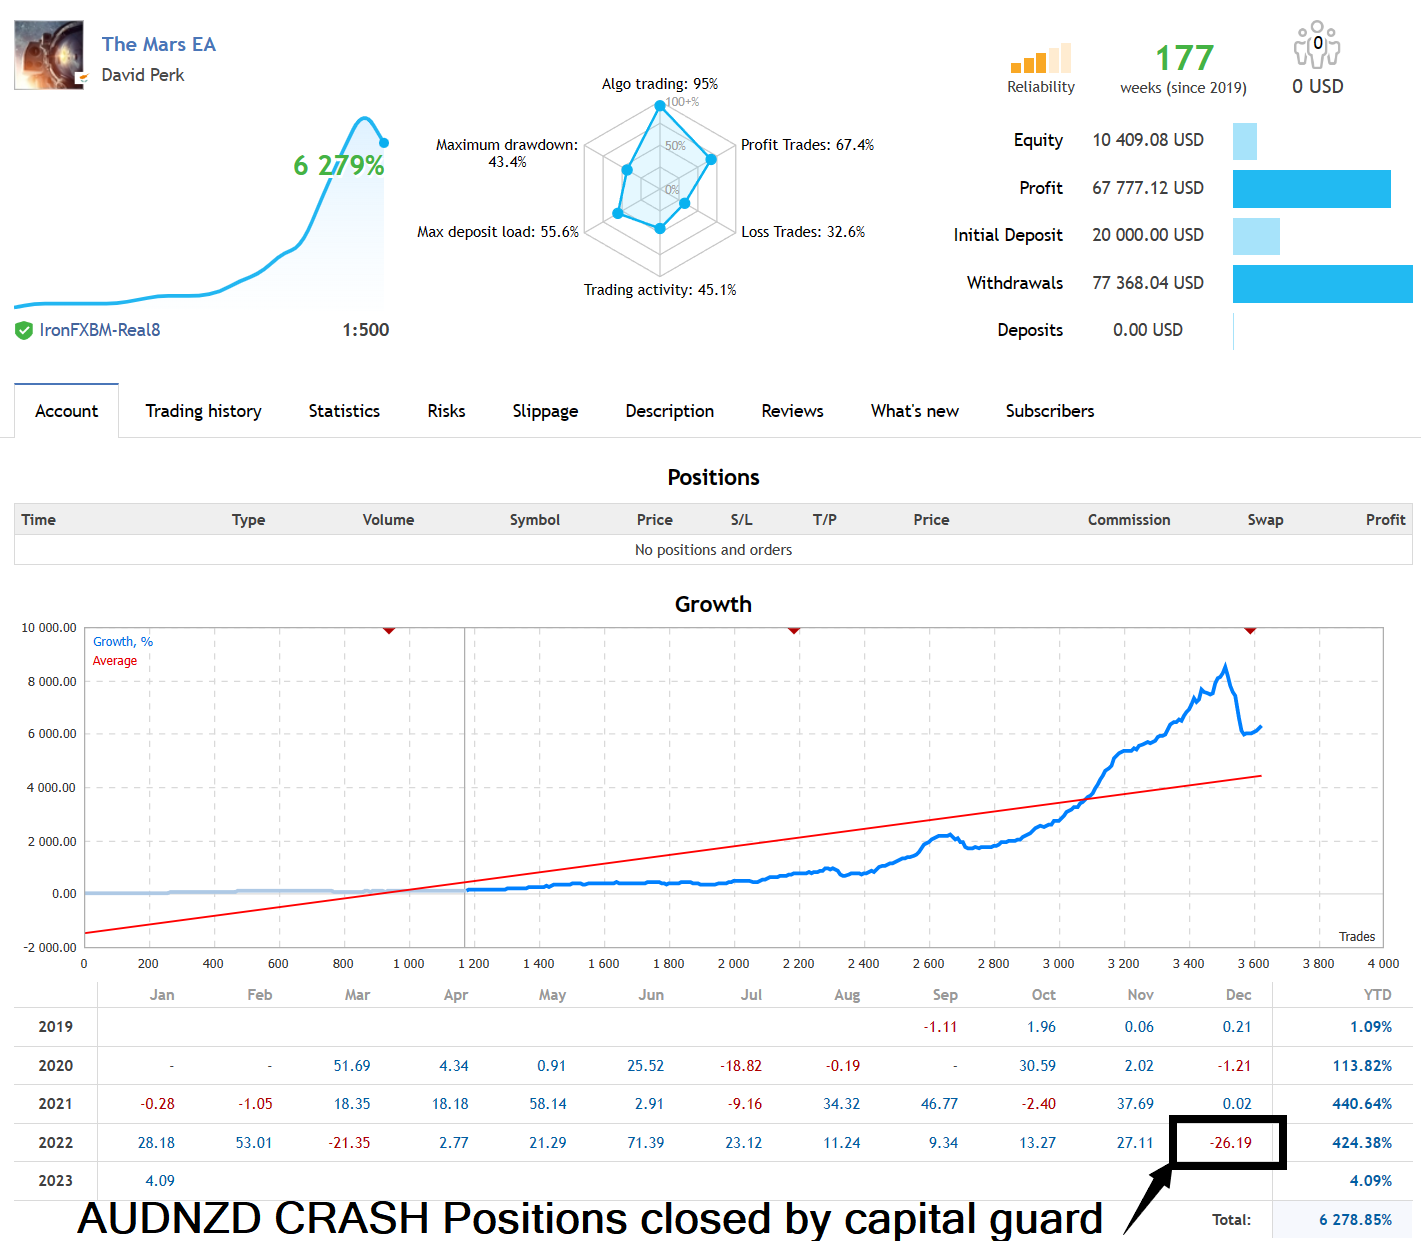
What to expect?
First of all, this is not a quick rich EA. But based on my Live results and back test you can get stable partial income. In my opinion the back test really never mirrors the real trading conditions, so I better calculated with deviations to 15% higher drawdown and 15% lower profits than what’s the outcome of the back tests.
Based on 10 years back test for the basic commodity portfolio. With most two optimal settings performed in average yearly profit 79 – 186% with, max drawdown 35% in the extreme conditions for the single pair. Which is amazing results.
The Mars Secure margin drawdown function doesn’t allow the drawdown to happen in the same moment on all pairs. My calculations for the worst-case drawdown with optimal portfolio would be bellow 45%. So, with relatively conservative settings we can expect between 5 -10% monthly average with usual drawdown 15% and our worst drawdown should not exceed 45%.
On the tab bellow you can see 10 years back tests of the single pairs with the different auto lot settings. On the right side of the tab is calculated average yearly profit and drawdowns.
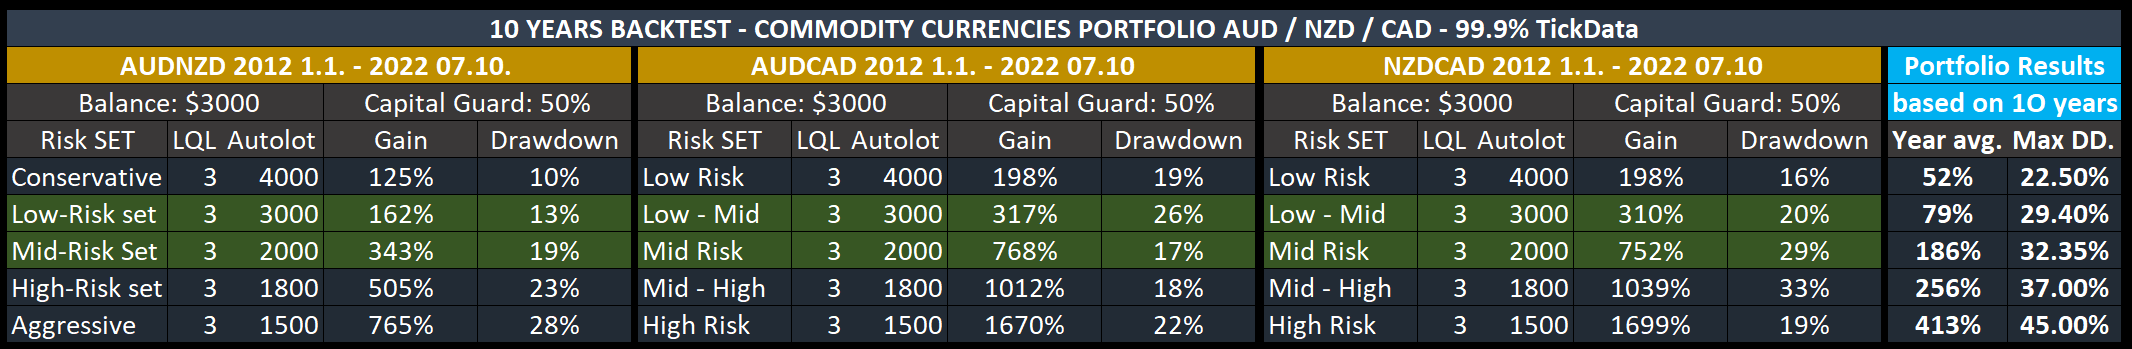
* This is the back test based on the 10 years of history. Note that world is in the recession. Market can behave differently.
Installation
All the settings mentioned above were implemented to the EA and only thing you need to do is to pick up what fits you most. If you need help you can of course contact me anytime but remember. I’m not financial advisor. I only provide my tool that servers me well and based on the probabilities it could continue to do so in the future.
Main advantage of trading with expert advisors is that it eliminates emotional based decisions and mistakes which we could do as humans.
Trade with such settings s that you can sleep calmly and without checking your phone every hour.
After buying the EA, please comment and write review and I will add you to our private discord group.