
Technical analysis is the study of price movements without regard for the reasons behind them, with the expectation that recent price movements will continue and thus offer you a profit opportunity. In technical analysis, indicators on a chart are the central decision-making tool.
Some facts about technical analysis:
- What we called technical analysis today was started by observations made by Charles Dow, a founder of Dow Jones, before the turn of the 20th century. Forex was the first asset class in which technical analysis was widely embraced, starting in the late 1970’s when computers and especially the PC became widely available. Historically, technical analysis was devised and first practiced in the equity market, but was always a poor cousin compared to fundamental analysis after Graham and Dodd published a path-breaking book, Securities Analysis, in 1934, that emphasized “value investing.” By about 2000, the majority of professional Forex traders were using technical analysis while fewer than half of equity analysts were using it, or admitted to using it.
- Technical analysts dislike the term “forecast” because what is really being measured and estimated is a probable range of likely outcomes, not a scientific pinpoint forecast. Technical analysis is an empirical science in which observation of likely outcomes far exceeds theoretical underpinnings. Various competing theories underlie some of the techniques but you do not need to adopt any particular theoretical construct in order to use technical analysis techniques.
- Technical analysts believe that prices are not random and that they move much of the time in repetitive patterns that can be identified and exploited for trading gain. The reason for patterns to appear and re-appear is human behavior among the universe of traders in any single security or asset class rather than any characteristic that is intrinsic to the security.
- Technical analysts believe that everything important in the economic and financial environment, including data and news about the security itself, is already reflected in the price, and therefore a technical analysts can choose to track the environment or not, as he wishes. This is termed “discounting.” The important point is that technical analysis is not antithetical to fundamental or economic analysis. Advanced technical analysts try to blend or merge both technical and fundamental analysis in order to refine their forecasts.
- All technical analysis techniques are based on past price movements, however recent, and therefore the forecasting aspect is a skill that the analyst brings to the exercise. On any single chart, there are numerous equally valid ways to place indicators. Equally successful technical traders can use the same indicators and arrive at different trade metrics—stop placement, for example. Give ten analysts a single indicator and a single security, and at the end of a trading contest, you will have ten outcomes, and all of them may be a net gain.
- Everything works. Each technique has its own virtues and drawbacks. Every technique can be applied profitably. Give each of ten technical traders a different technique on the same security and at the end of a trading contest, each of them may be profitable.
The Core Concept
Supply and demand for a security, and thus its price, rise and fall for reasons that have to do with trader sentiment and perception of profit opportunity. Sentiment and perception of profit opportunity may arise from changes in conditions and news, but technical analysts are more interested in what the price is doing and likely to do in the near future than in the reasons behind the price move. This is sometimes expressed as “what” the price is doing rather than “why” the price is doing it.
The authors of the first major book on technical analysis, Edwards and McGee in the late 1940’s, noted the core pattern that all price series exhibit to a greater or lesser degree:
- A primary move upward, followed by
- a flat or sideway-range trading period or by
- a secondary pullback move downward that retraces some but not all of the original upward move, followed by
- another upward surge that surpasses the previous high and restores the primary move.
For a downmove, reverse the picture in your head.
One of the first popular trading systems based on the Edwards and McGee observation was devised by someone from outside the financial industry, a Hungarian economist émigré to the US named Nicolas Darvas, who superimposed “boxes” on this step-like pattern. He wrote a best-selling book about it, How I Made 2,000,000 in the Stock Market. One component of the Darvas box system was to buy when a stock hit a 52-week high, placing a stop at the previous lowest low. The first trade is done at the 52-week high and subsequent trades are made on the breakout above the previous box. It is a simple breakout system using rectangles and is still in use today.
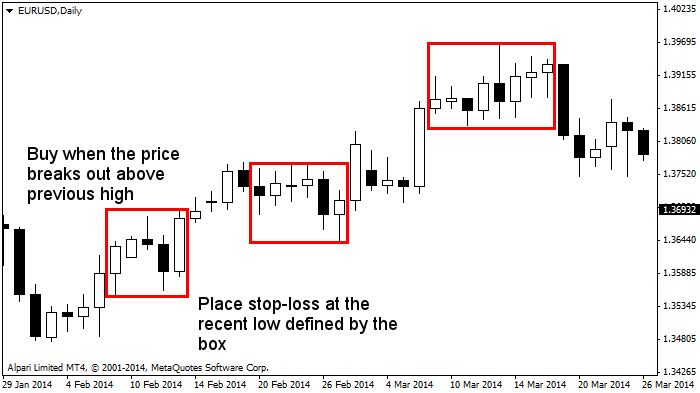
The Darvas box may be overly simple or even crude, but it illustrates the point that prices move in bursts, followed by sideways or pullback secondary moves, before another burst in the original direction. Later analysts called these bursts “impulses” and “waves.” Whatever you chose to call the pattern, it is the core conceptual observation of all technical analysis.
- If you are a trend follower using longer-term indicators like the moving average, you must reconcile yourself to pullbacks that may threaten your profitability.
- If you are a breakout trader, you must accept that some breakouts will be false and your stop will get hit.
- If you are a momentum trader, you must accept that securities sometimes exhibit no directional momentum and range-trade sideways instead, rendering momentum indicators misleading.
Tip: You may think that it’s a good idea to read everything that professional analysts have to say about a security, but beware — some analysts will be “talking their position” (advocating a direction in which they already have a stake to lure you into the same trade) or talking through their hat. The wise technical analyst looks to what prices are doing on the chart and not what analysts are saying about the prices. The chart is a tool for cutting through the clutter of commentary.
Quiz: