
Visualizing changes in asset values makes it easier to track trends. This is why Eastern analysts were not satisfied with traditional candlesticks and created alternative ways of representing price changes. One of them is the Renko charts designed to simplify trading by reducing market noise. Today I will tell you what Renko bricks are, how to work with them, what signals they can provide and how they can help in trading.
The article covers the following subjects:
What is Renko Charts?
Renko is a type of chart for displaying asset price moves. This is an alternative to Japanese candlesticks in representing price changes. The Forex Renko chart looks like two-colored bricks of the same length and width, where each subsequent brick is either higher or lower than the previous one.
The EURUSD chart shows an example of what Renko looks like. Please note that unlike Japanese candlesticks, the bars, or rather bricks, are drawn without shadows. Although in some variations, Renko bars may also have wicks. But the traditional Renko looks exactly like this.
Renko charts, like Heiken Ashi, show price moves free from minor price movements. Filtering makes trend detection easier. The bars are the same size because time is not taken into account in the system.
Usually you specify the size of one brick in the settings along with the formation period. It represents the number of data points that the price must pass in order for the indicator to draw one bar. The larger the size, the less movement, but the higher temporary deformations and smoothing. Therefore, a smaller Renko brick size increases the sensitivity to volatility.
I will give an example for better understanding. For instance, you have specified the size of the smoothed brick as 20 points in the trading terminal settings. This means that each bar will be drawn when the asset value changes by 20 data points. It can happen in a minute, in an hour, in a day, or in a month – time does not matter.
In the picture above, I’ve marked the bricks formed from March to April with a blue rectangle, and from April to May with a red one. If we count them, it turns out that 19 bars were formed in March, and only 4 in April.
Renko perfectly demonstrates how the Pareto rule works. Let me remind you that in trading it boils down to the fact that about 80% of the time the markets are in a state of expectation or flat. During this period, trading is ineffective. And only in the remaining 20% of the time there are significant trends that can bring tangible profits.
Important! In MT4 and MT5, you can add these charts only as an indicator Renko, which is superimposed on top of regular bar charts. It also needs to be downloaded from the community portal and installed separately as an add-on. This is why I prefer to view the Renko chart patterns in LiteFinance online terminal. Here you can select this type of chart without any additional settings. In this case, the bricks completely replace Japanese candles, which is very convenient.
History of Renko Charts
Brick charts were invented hundreds of years ago by rice traders. Rather than recording every fixed price movement for their product, the merchants made up a system to record only important changes. This way they saved their time, paper, and ink.
There are two translations of the Japanese word Renko: “brick”, as I’ve mentioned above, and “quiet path”. The second option reflects the essence of these charts as a slow-paced smoothed model of price changes, in which there are no sharp insignificant movements. While they used to be plotted manually on paper, with the introduction of digital systems they are now constructed in automatic or semi-automatic mode.
In the financial literature, the first mention of Renko is in the book Beyond Candlesticks by Steve Nison. In it, the financial analyst described the principles of building the bar charts and working with them, and talked about the basic Renko strategies that are still used on Forex by many traders.
Renko Bars (Bricks)
Like Japanese candlesticks, the Renko brick size can be ascending and descending. The classic coloring for previous bricks during growth is green bricks or white, and during decline — previous bricks are red or black.
A new brick is formed when the value of an asset changes from the last fixed price by an amount greater than the bar size, or threshold. The threshold is measured in points and specified in the settings. In the classic version, it is about 1% of the current price.
The default settlement price relates to the closing prices. But if necessary, the investor can rely on any parameters. For example, some traders calculate from highs or lows on small timeframes.
An ascending brick forms when from the moment of the last brick close, the price has increased by a value greater than the specified threshold over a period of time within the chosen timeframe. A descending brick forms when the price has decreased by a value greater than the specified threshold. In this case, the number of new Renko bricks will be equal to the multiplicity factor of the price change to the specified threshold.
So a brick size can contain any number of periods of minor price movements. For example, with a threshold of 10 points, a price increase from 100 points to 108 and a subsequent fall to 105 will not be reflected in the chart in any way, since these changes did not go beyond the specified threshold. However, when the price surpasses the 110-point mark, a new up brick will form. Or if it breaks the 90-point mark, new down bricks will appear in the chart.
The appeared brick size can disappear if the price has time to roll back within a given period of time. This means the bricks have a fixed price only at the close of the period. For example, for the daily timeframe, they will be fixed at the close of the trading day, and for W1 — after the end of the trading week.
Renko settings
The most important setting in the online terminal is the size of the bricks.
You can find it in the general chart settings. To do this, click on the gear icon in the upper left corner.
In the window that opens, go to the “Tools” tab. Now you can change the “ATR Renko Length” parameter as you wish. This setting regulates the size of the bricks, but not in points – rather by ATR. Below I will explain what ATR is and how this parameter is calculated.
How to use Renko Charts
The same trading signals are used for Renko charts as for regular Japanese candlesticks:
Let’s look at them one by one.
Support and Resistance Levels
Sometimes the price rolls back after reaching a certain level. If this level is below the price, it is called the support level, and if above — the resistance level.
Such signals appear on any timeframe and are very popular when trading on candlestick charts. What about brick charts? Do you need to identify key support and resistance levels?
Let’s take the GPBUSD chart as an example. Here we have Japanese candlesticks. The resistance level is determined by local highs. In the chart, the price closes at the same mark at least twice and then reverses.
For comparison, we’ll look at the same currency pair. But instead of regular charts, we’ll use Renko. Here we can find the resistance level much easier due to the smoothed volatility. Ideally, this level will lie on two tops and will be confirmed by a retest of the third one. To determine the support level, use the same rules, only you need to look at the double bottom patterns.
Breakouts
Continuing the topic of support and resistance levels, consider what happens when a level is broken. In this case, as with regular bar charts, we should expect the trend to continue. That means the continuation of the upward movement and up bricks if the resistance level was broken, and downward movement in case of the support level.
The chart above depicts a breakout situation. Here, immediately after the breakout, it makes sense to open a long position in the area of the green bricks oval expecting the continuation of the trend.
Overbought & Oversold
Even if you are still learning how to trade on the Forex market, you have probably heard about overbought and oversold more than once.
Overbought market is when the majority of market participants are already in the long and there are few active swing traders. Oversold is the opposite situation, when after panic sales, the majority of players are either in short positions or out of the market, so there is a large imbalance towards the bears. Such phenomena are considered powerful signals for an imminent market price reversal. In the chart, the current trend may develop by inertia for some time. However, this development is unlikely to be accompanied by a significant price shift.
The peculiarities of displaying the price movements in Renko charts do not help to determine the overbought and oversold conditions. However, this situation can be predicted indirectly when, despite the long duration of the trend, the movement does not correct.
In the chart above, we can see that the last brick wave is comparable to the wave at the beginning of the trend. By comparing the current green bricks band with the longest continuous band in the structure, we can calculate the trend reversal location.
For additional indication of these oversold and overbought areas we can use classic oscillators. For example, the RSI. For those who want to learn more about this financial instrument, I recommend reading the article “RSI Relative Strength Indicator”.
In the XAUUSD chart, the continued development of the bullish trend has led to the emergence of an overbought market, which is marked with a blue circle in the RSI indicator. Subsequently, the signal was confirmed by a change in the trend direction to downward.
Fibonacci levels
Fibonacci levels also perform well with a brick chart.
I placed a Fibonacci grid on the EURJPY chart. I took the starting point of a large trend as the zero mark, and its top as 1. The arrows mark the local extremes, where the chart touched the Fibo levels.
The smoothing increases the accuracy of Fibonacci level touches. So we get a visual grid of resistance and support levels, which can be used as a confirming indicator for channel trading systems and trading on breakouts.
Renko charts and graphic patterns
Chart patterns are suitable for trading Renko and are no worse than other technical analysis methods. There are classic patterns that are even easier to spot when using Renko charts than a regular candlestick chart:
Head and shoulders. A price reversal pattern in the form of two smaller tops (shoulders) and a head between them – a local high. It should be traded from the neck level.
The purple lines mark the outlines of the head and shoulders. And the blue line is the neck level, where you should open a short position. In practice, such a pattern will not always be perfectly flat, as in books. However, in the case of Renko, this pattern is much easier to identify due to the lack of market noise.
Double top. Appears after prolonged growth. It occurs when the price first tests the resistance level and then the brick forms a local high. It should be traded when the retracement pivot point is crossed after the first top.
The EURUSD chart shows an example of the double top. A short position should be opened when the local bottom of this pattern is crossed (blue line).
Double bottom. The pattern is similar to the double top, but it occurs at the end of a bearish trend.
Similar to the top, the double bottom is a reversal pattern. A long position should be opened at the crossing of the correction end point (blue line).
Renko Charts Calculation
You already know that the formation of a new brick occurs when the change in the value of an asset exceeds the specified size of a brick. Let’s see how this size is calculated when using Renko charts.
There are three common brick calculation methods:
In the classic version, bricks are measured as a percentage of the asset’s current value. Typically a range of 0.25% to 1% is used. The lower the value, the more often new bricks will appear. But the smoothing will be less noticeable. With an increase in the coefficient, the smoothing increases and new Renko bricks are formed less frequently in contrast to the previous bricks.
ATR (Average True Range) is the range that shows how much the value of a financial instrument has changed over a certain period of time. In other words, it shows the volatility of an asset. Average True Range is determined by calculating the moving average of the largest among the modules of three values:
The period of this moving average is set in the terminal settings. After this, the calculator calculates the ATR value in a regular chart and assigns it to the pre determined brick size. This method allows you to weed out the vast majority of noise and leave important market movements, regardless of whether volatility grows or falls.
The last from the brick calculation methods is the traditional classic one. It suggests that the trader should determine the Renko brick size by manually setting a constant value expressed as a number of points.
How to calculate Renko Chart on excel spreadsheet
If for some reason you do not want to use ready-made indicators and advisors, you can calculate brick parameters using Excel spreadsheets. You can download an excel table with a ready-made formula for calculating a Renko chart from my google drive here.
You can also download the original file after registering on the website tradinformed.com
You will need historical data to work with the table.
Let’s open the archive in MT4 by pressing the F2 button.
In the archive, you need to select the desired trading instrument and timeframe. In the picture above, I showed how to choose a 4-hour chart for the EURUSD currency pair.
After selecting an instrument, historical data will appear in the table. It is better to immediately export it to a separate table by clicking on the “Export” button.
Now let’s open the downloaded table with Renko formulas. The Data tab contains all the initial data necessary for calculating the bricks. Copy the historical data in sequence: in the vertical columns Date, Time, Open, High, Low, and Close. The picture above shows how the filled cells should look like.
When filling in the columns with historical information in the following columns from G (Target Long) to M (Bar Number), the lines must be extended to the end of the entered data. This way the number of rows in these cells corresponds to the amount of historical data.
Next, you need to specify the pre determined brick size in the Renko tab, after which the chart will be automatically calculated. Below there will be a graphical display in the form of green boxes and red bricks and the same chart in the form of a classic price line for comparison.
Comparison to Candlestick Charts
Two years ago, I did an interesting experiment comparing Japanese candlestick charts with Renko charts. You can read more about it in my article “Non-standard use of classical indicators. The Big Experiment Part 1“. Here I will only give you my brief conclusions.
I have already mentioned the most important differences above. One, it’s the smoothing, which removes almost all minor price movements. Two, the bricks are not tied to the time axis. This makes it difficult for novice traders to compare both types of charts.
Three, it should be borne in mind that indicators work differently for the candlestick or bar chart and Renko. Let’s look at an example using the MACD.
In the daily chart, I took approximately the same period from the end of 2018 to the current moment. Pay attention to how many crossings of lines and transitions from the positive to the negative zone there are when using Japanese candlesticks. The scale of the chart speaks volumes too.
Now look at Renko. Despite the fact that the chart was based on the same timeframe, the number of MACD signals is much smaller, and their quality is higher.
Four, there is a strong delay. Renko is a lagging indicator. The MACD is based on moving averages and is also lagging. Thus, the indicator signal in the Renko chart will lag significantly compared to the candlestick or bar chart.
Manual selection of the optimal size of bricks and timeframes can help the situation slightly. This can only be done experimentally, but the gap with the candlestick chart will still remain.
Five, bricks are not suitable for analyzing trading volumes, unlike a candlestick chart. This means that you shouldn’t even try to use any trading strategies related to volumes.
Six, the interface difference. The bricks are always the same size and have no shadows. This means that candlestick patterns, which occupy an important place in technical analysis, are not applicable to them. Of course, no one prevents you from looking at both types of charts at the same time, using candlestick patterns as the primary sign of a reversal and bricks as additional confirmation of your forecasts.
How To Add Renko Chart To MT4
Unfortunately, Renko charts are not included in the standard MetaTrader toolkit. So to use the bricks, you will need to install additional indicators. I recommend downloading them from the community website www.mql5.com. I’ll tell you about the most interesting tools for using Renko charts in MT4.
KT Renko Live Chart
This is a simple indicator that displays bricks without any additions. This makes it compatible with most custom indicators and advisors.
The link to download the KT Renko Live Chart indicator is here.
KT Renko Patterns MT4
A handy tool from the developers of Renko Live Chart, which identifies graphic patterns in the chart and displays them as colored lines. The features include notifications about reversals.
The link to download the KT Renko Patterns indicator is here.
TSV Renko FX
This tool places semi-transparent bricks on a candlestick chart. Each brick is displayed as a colored area through which traditional Japanese candlesticks can be seen. Thanks to this, it is easy for a swing trader to compare the Renko chart with the Japanese candlesticks.
The link to download the TSV Renko FX indicator is here.
Renko Shade
Another indicator that draws bricks in the form of translucent areas. But unlike the previous tool, it provides each brick with a semitransparent shadow, which helps to see which bars correspond to which brick.
The link to download the Renko Shade indicator is here.
AG Renko
This indicator generates bricks on the candlestick chart as colored lines. During an upward movement, an up brick consisting of blue lines is formed, and during a downward movement – red ones. Another interesting feature of AG Renko is the indicators in the form of blue and red arrows that appear when a signal to enter the market occurs.
Link to download the AG Renko indicator here.
Let’s look at the application of Renko charts indicators in MT4 using the example of AG Renko.
Unpack the downloaded archive and move it to the “Indicators” folder. After restarting MetaTrader, the tool will appear in the list of indicators.
To add AG Renko to the chart in the main menu, which is located in the program header, open the “Insert” tab. Then select the items “Indicators”, “Custom” and in the list that opens, click on “AG_Renko_Chart”.
You can then click on the “OK” button to display the indicator with the default settings or specify your own parameters in the same window.
In the second case, the “Input parameters” tab is of the greatest interest. Here you can specify the size of the bricks and the features of the signal display.
In the chart, the indicator looks as shown above. The bricks are displayed as lines. The blue lines are for an upward movement, and the red ones for a downward movement.
Renko Charts with other Indicators
Bricks can be easily combined with many classic indicators and methods of representing price movements. Below I will tell you about the most popular combinations.
Heikin Ashi vs Renko
Combining these two alternative charts can produce amazing results.
Heikin Ashi is a trend representation of price movement that, like Renko charts, smooths out volatility. Bar charts are plotted by averaging four parameters: open (bar open), close (bar close), max and min (maximum and minimum price data values). You can read more about Heiken Ashi and its trading methods in my article here.
The combined use of Heikin Ashi and Renko charts allows you to take advantage of both views and neutralize their disadvantages. The Renko chart gives more accurate signals but with a greater lag. To minimize the negative effect, you need to choose the correct brick size and monitor the chart on a lower timeframe than Heikin Ashi.
It is convenient to use the confirmation signals of the Heikin Ashi indicator to enter and exit the market.
For clarity, let’s consider an example with the XAUUSD pair.
In the daily chart above, you can see how, after the triple bottom pattern formed, there was a breakdown of the resistance level at 1350 USD around June 30, 2019.
A sell signal will be processed using a similar algorithm.
First, we wait for the signal of the breakout of the support level in the Renko chart. Above is an example of a possible Triple Top reversal pattern in the daily Gold chart. If such a signal is confirmed by a signal in the weekly Heikin Ashi chart, the long position should be closed.
Renko and MACD
The MACD indicator works well with Renko bar charts. I wrote about it in detail in the article “MACD Moving Average Convergence Divergence Indicator in Forex“. For Renko charts, the same indicator signals work as for candlestick charts. Those include:
-
crossing of moving averages;
-
the diagram moving from the positive zone to the negative zone and vice versa;
-
divergence of the main chart with the indicator chart.
Let’s consider these signals through examples.
The MACD indicator shows the crossover of moving averages from the bottom up. This is a sign of the beginning of a bullish trend. So we should open a long position (blue line) after the appearance of the signal.
The transition of the MACD chart from the positive to the negative is a sign of a downward reversal, and the change from the negative to the positive, as in the chart above, is a signal for an upward reversal. After the first positive bar of the histogram appears, enter the market to buy (blue line).
Divergences and convergences connecting the extreme points of the chart and the moving average of the indicator are powerful reversal signals. A more accurate one than the previous two. This signal was analyzed in great detail in the article “Divergence and Convergence in Forex. What it is and how to use it correctly”.
In the chart above, we can see that the black line in the chart is directed downwards, while on the MACD, on the contrary, it is directed upwards. This is a classic bullish divergence. This means we should expect a trend reversal upward.
Renko with Bollinger Bands
Renko charts typically work in conjunction with Bollinger bands no worse than Japanese candlestick charts. Earlier I discussed this indicator in detail in the article “Forex Bollinger Bands Indicator“.
In short, the combination of the chart with bricks and Bollinger bands can give us the following signals:
-
Buy signal: the bar crosses the middle line from the bottom up, the upper and lower bands diverge in different directions.
-
Sell signal: the bar crosses the middle line from top to bottom, the upper and lower lines diverge in different directions.
The signal to close a position will be when the price closes touching the Bollinger Band or approaching it. Set your stop loss at the line opposite to the expected trend.
Let’s consider Bollinger trading using an example:
The blue arrow marks a bar that crosses the middle line of the indicator. Since the crossover was from the bottom up, open a long position at the level of the blue line. Set stop loss in the vicinity of the opposite band (red line).
After the chart reaches the upper Bollinger band, there is a threat of a reversal. Therefore, at this moment it is better to exit the market with a profit (green line).
Pros & Cons of Renko Charts
If you try to use a Renko chart instead of regular bars even once, you will find that they are very convenient for analyzing price action movements.
But there are more advantages to these charts. They also have flaws, but there are still more pluses:
|
Advantages |
Disadvantages |
|
It is easy to determine the direction of the market – trend and trade channels. |
Smoothing removes not only market noise, but also volatility useful for analysis. Because of this, trading based only on bricks leads to problems with the analysis of leading signals. |
|
Buy and sell signals are easy to read – changing the color of a brick in the chart is already a signal to buy or sell. |
The bricks signal developing trends with a lag. The delay is different each time. It is especially noticeable during the period of consolidation. |
|
They are well suited for trading on support and resistance levels (including breakouts) |
It is not possible to use indicators related to measuring trading volumes and directly linked to the time scale. |
|
A classic technical analysis indicator that, without measuring volumes, generates high quality trading signals in the chart, which are often better than in Japanese candlestick charts. |
|
|
Easy detection of various graphic patterns and high quality of their signals. |
|
Renko charts strategies
Many of the classic trading strategies originally developed for Japanese candlestick charts can be used for Renko charts. Below I will share two charting techniques that I find the most interesting.
Trendline breakout
Trading on a trend breakout is a simple and effective trading strategy. The essence of the charting technique is to build a trend line based on extreme points and record its breakouts. For a bullish trend, the line is drawn based on the points of local lows, and for a bearish trend, it is built on the highs.
A breakout of the trend line indicates a reversal and the beginning of movement in the opposite direction. I recommend using confirmation bars for greater accuracy. This is the next brick following the breakout prior brick and developing in the same trend direction as the previous candlestick.
Let’s look at an example.
In the EURUSD chart, I drew a black trend line at the lows of the uptrend. The purple arrow marks the moment of the false crossover. Here the trend line was crossed by only one Renko brick, which means that we should not consider this event as a signal for a reversal of the price data movement.
The next crossover is confirmed by the appearance of a second downward Renko brick (blue arrow). Open a short position immediately after its formation. Set stop loss at a level above the nearest top. Since we can see no shadows on the bricks, the exact stop loss position should be determined using the Japanese candlestick chart.
We will look for the moment to exit the market based on the crossover of the trend line as well. Therefore, at the end of the second short-term correction we connect its top and the top of its predecessor with a black line. After a while, an crossover occurs. Close the position with profit on the second green bar (green line).
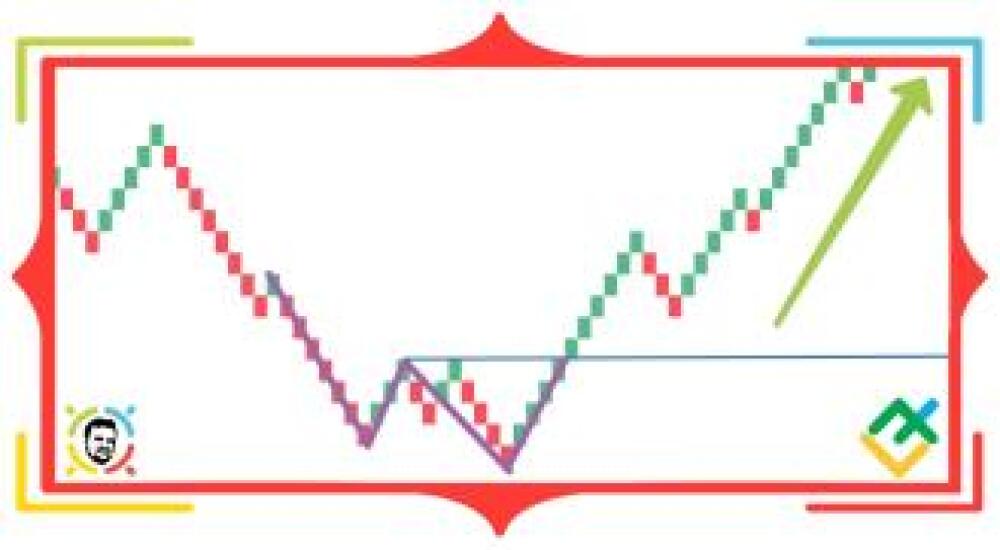
Support and resistance breakout strategy
This trading method is very similar to the strategy described earlier, but it needs to identify key support and resistance levels instead of a trend line. First, let’s learn how to build them.
Levels are plotted according to matching highs and lows. That is, in the areas where growth or decline run into some kind of obstacle.
In the chart above, I marked the resistance level with a black line, and with purple circles – the moments when the growth stopped as this level was reached. Note that matches do not have to be perfect. For this trading method, we will assume that the permissible error is one bar.
After determining the resistance level, we wait for its crossover. As in the prior brick strategy, the formation of the second bar in the direction of the assumed trend will be a confirmation of the intersection. It is marked with a blue arrow in the chart.
Now you can open a long position at the blue line. Since the nearest local lows are far away, we set the stop loss a few bars below the resistance level (red line).
During the development of the trend, we take the profit when reversal signals appear. In our case, a double top is forming. So when its base is crossed, close the long position (green boxes line).
Both strategies are basic and can be easily combined and supplemented with signals from classic overbought and oversold indicators, such as MACD and RSI, Fibonacci grid, analysis of chart patterns, and candlestick chart analysis.
P.S. Did you like my article? Share it in social networks: it will be the best “thank you” 🙂
Ask me questions and comment below. I’ll be glad to answer your questions and give necessary explanations.
Useful links:
- I recommend trying to trade with a reliable broker here. The system allows you to trade by yourself or copy successful traders from all across the globe.
- Use my promo-code BLOG for getting deposit bonus 50% on LiteFinance platform. Just enter this code in the appropriate field while depositing your trading account.
- Telegram chat for traders: https://t.me/litefinancebrokerchat. We are sharing the signals and trading experience
- Telegram channel with high-quality analytics, Forex reviews, training articles, and other useful things for traders https://t.me/liteforex
The content of this article reflects the author’s opinion and does not necessarily reflect the official position of LiteFinance. The material published on this page is provided for informational purposes only and should not be considered as the provision of investment advice for the purposes of Directive 2004/39/EC.