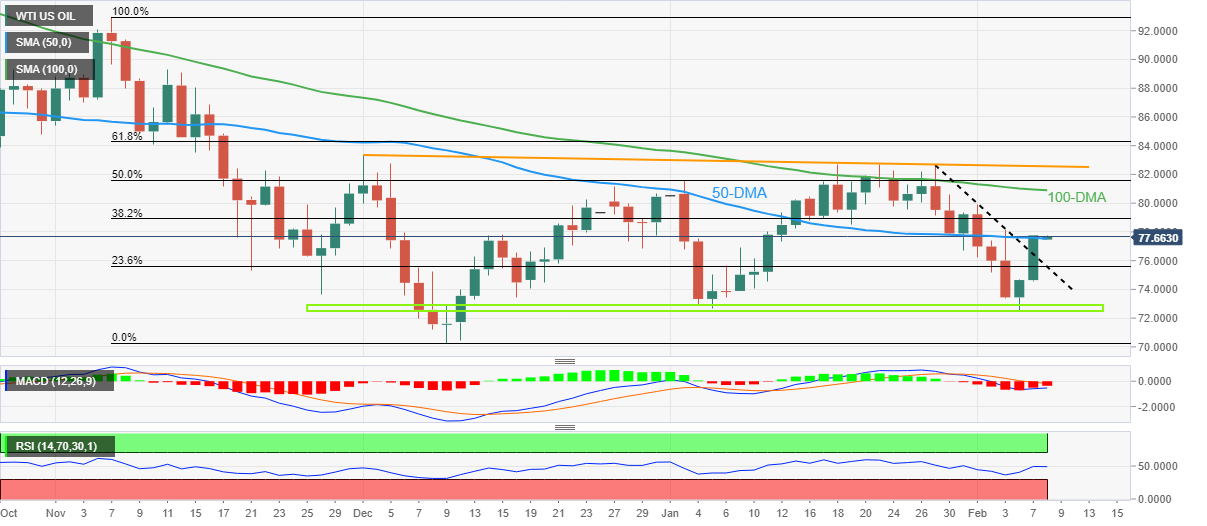
- WTI grinds higher after crossing one-week-old resistance line.
- Unimpressive oscillators, 50-DMA challenges Oil bulls ahead of the key 100-DMA hurdle.
- Pullback remains elusive below $75.60 support confluence, $73.00-72.50 region appears a tough nut to crack for bears.
WTI crude oil struggles to extend the previous day’s stellar run-up around the weekly top, making rounds to $77.70-60 during early Wednesday. In doing so, the black gold seesaws around the 50-DMA amid sluggish RSI (14) and MACD signals.
It’s worth noting, however, that Tuesday’s upside break of a one-week-long descending trend line keeps WTI bulls hopeful.
Hence, a clear upside break of the 50-DMA hurdle, currently around $77.80, appears necessary for the WTI bulls to keep the reins.
Even so, the 100-DMA and a two-month-old descending resistance line, respectively around $80.90 and $82.70, could challenge the Oil buyers before giving them control.
That said, the 61.8% Fibonacci retracement level of the commodity’s November-December 2023 downturn near $84.30, also known as the “Golden Ratio”, acts as the last defense of the Oil bears.
Meanwhile, the resistance-turned-support line joins the 23.6% Fibonacci retracement to highlight $75.60 as the key support confluence for WTI bears to watch for taking entries.
Following that, a horizontal area comprising multiple levels marked since early December 2022, near $73.00-72.50, will be crucial as a break of which can quickly drag the prices toward late 2022 low near $70.30.
Overall, Oil buyers need to wait for a clear sign but the bears are clearly off the table.
WTI: Daily chart
Trend: Sideways

