
Introduction
VolatilityMarkets suggests top quant trade ideas to take advantage of trending markets.
Market summary
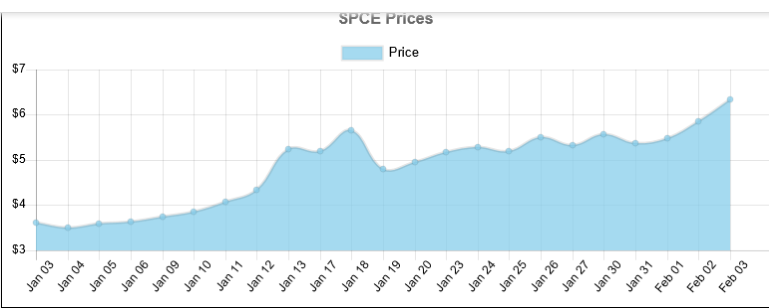
SPCE last price was $ 6.34. In the short term Virgin Galactic has been accelerating higher. In the long term Virgin Galactic has been accelerating higher. Over the past 22 days, the SPCE price increased 16 days and decreased 6 days. For every up day, there were 0.38 down days. The average return on days where the price increased is 5.4985% The average return on days where the price decreased is -4.4765% Over the past 22 Days, the price has increased by 75.14% percent. Over the past 22 days, the average return per day has been 3.4155% percent. With the short term trend being the stronger of the two, we propose a long trade idea with an overnight time horizon.
The trade idea
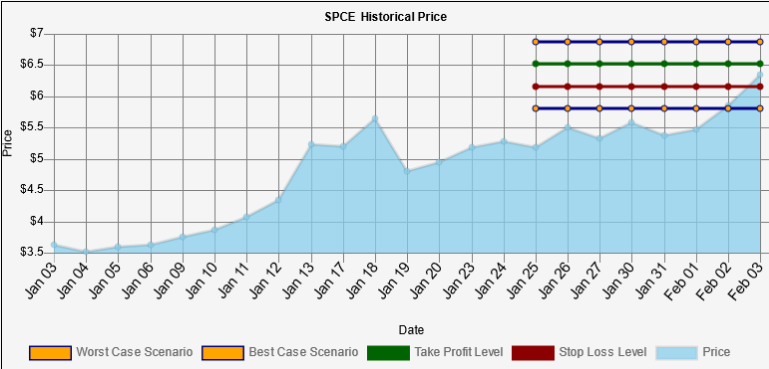
Buy $ 35,907 USD of Virgin Galactic, take profit at $ 6.5165 level with 50.01% odds for a $ 999 USD gain, stop out at $ 6.1634 with 50.0% odds for a $ 1,000 USD loss through O/N time horizon.
Intraday Predictions
SPCE trend analysis
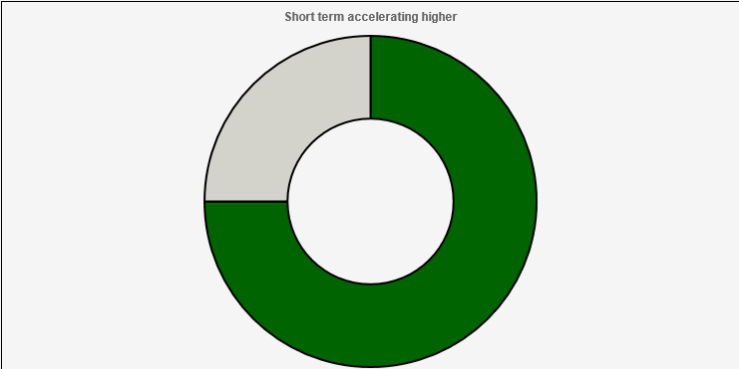
SPCE last price was $ 6.34. The short term trend accelerating higher is stronger than the long term trend accelerating higher. This trade goes long when the last change was higher and accelerating.
SPCE value analysis
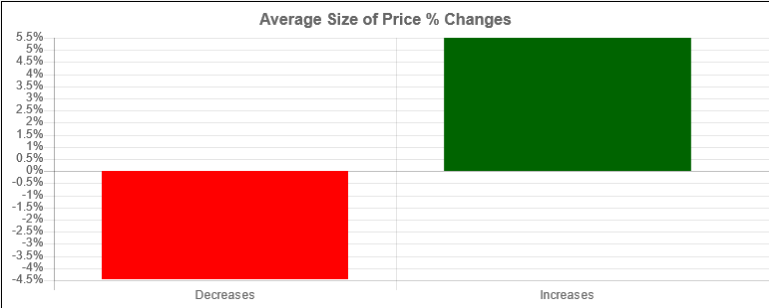
Over the past 22 days, the SPCE price increased 16 days and decreased 6 days. For every up day, there were 0.38 down days. The average return on days where the price increased is 5.4985% The average return on days where the price decreased is -4.4765% Over the past 22 Days, the price has increased by 75.14% percent. Over the past 22 days, the average return per day has been 3.4155% percent.
SPCE worst/best case scenario analysis
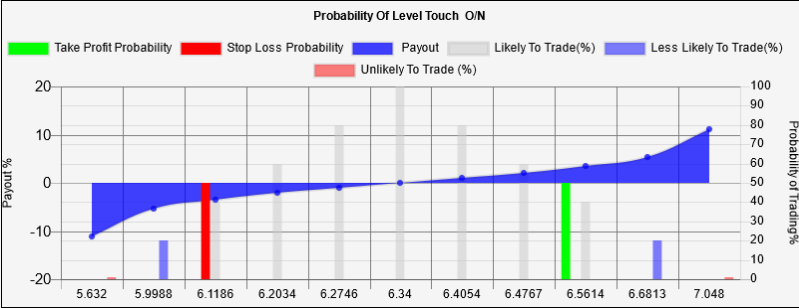
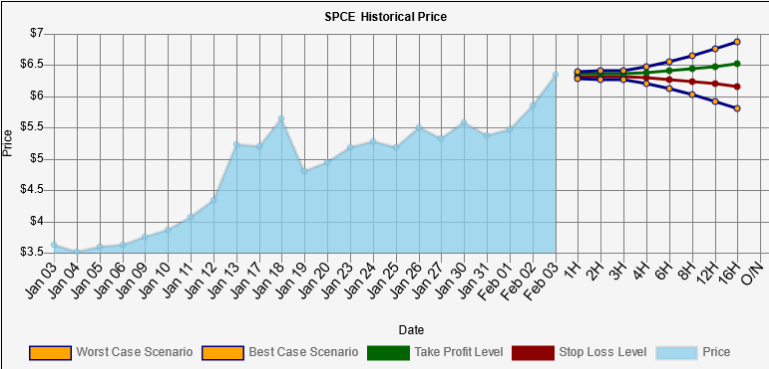
Within 1 week, our worst case scenario where we are 95% certain that this level won’t trade for SPCE, is $ 5.8091 , and the best case scenario overnight is $ 6.8709 . levels outside of this range are unlikely, but still possible, to trade. We are 50% confident that $ 6.1634 could trade and that $ 6.5165 could trade. These levels are within statistical probability.
Key Takeaways:
-
Price today $ 6.34
-
Over the past 22 days, the SPCE price increased 16 days and decreased 6 Days.
-
For every up day, there were 0.38 down days.
-
The average return on days where the price increased is 5.4985%.
-
The average return on days where the price decreased is -4.4765%.
-
Over the past 22 Days, the price has increased by 75.14% percent.
-
Over the past 22 days, the average return per day has been 3.4155% percent.
-
Over the past 22 days, The price has on average been accelerating: $ 0.0176 per day higher.
-
Over the last session, the price increased by $ 0.48.
-
Over the last session, the price increased by 7.571 %.
-
Over the last session, the price accelerated by $ 0.10.