
Gold Price (XAU/USD), Chart, and Analysis
- US interest rate expectations continue to fall.
- Gold looks like it is consolidating ahead of the next move higher.
Recommended by Nick Cawley
Get Your Free Gold Forecast
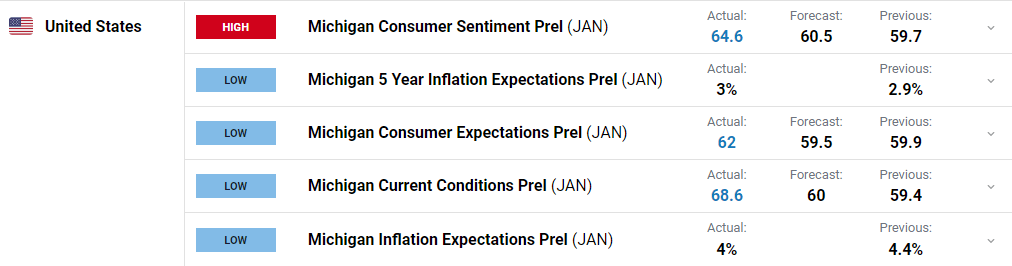
The latest University of Michigan Consumer Sentiment report, released last Friday, showed inflation expectations in the US continuing to fall. The one-year ahead inflation reading fell for the fourth consecutive month to 4%, the lowest level seen since April 2021. The five-year reading rose to 3% from 2.9% in November but remained within its recent range.
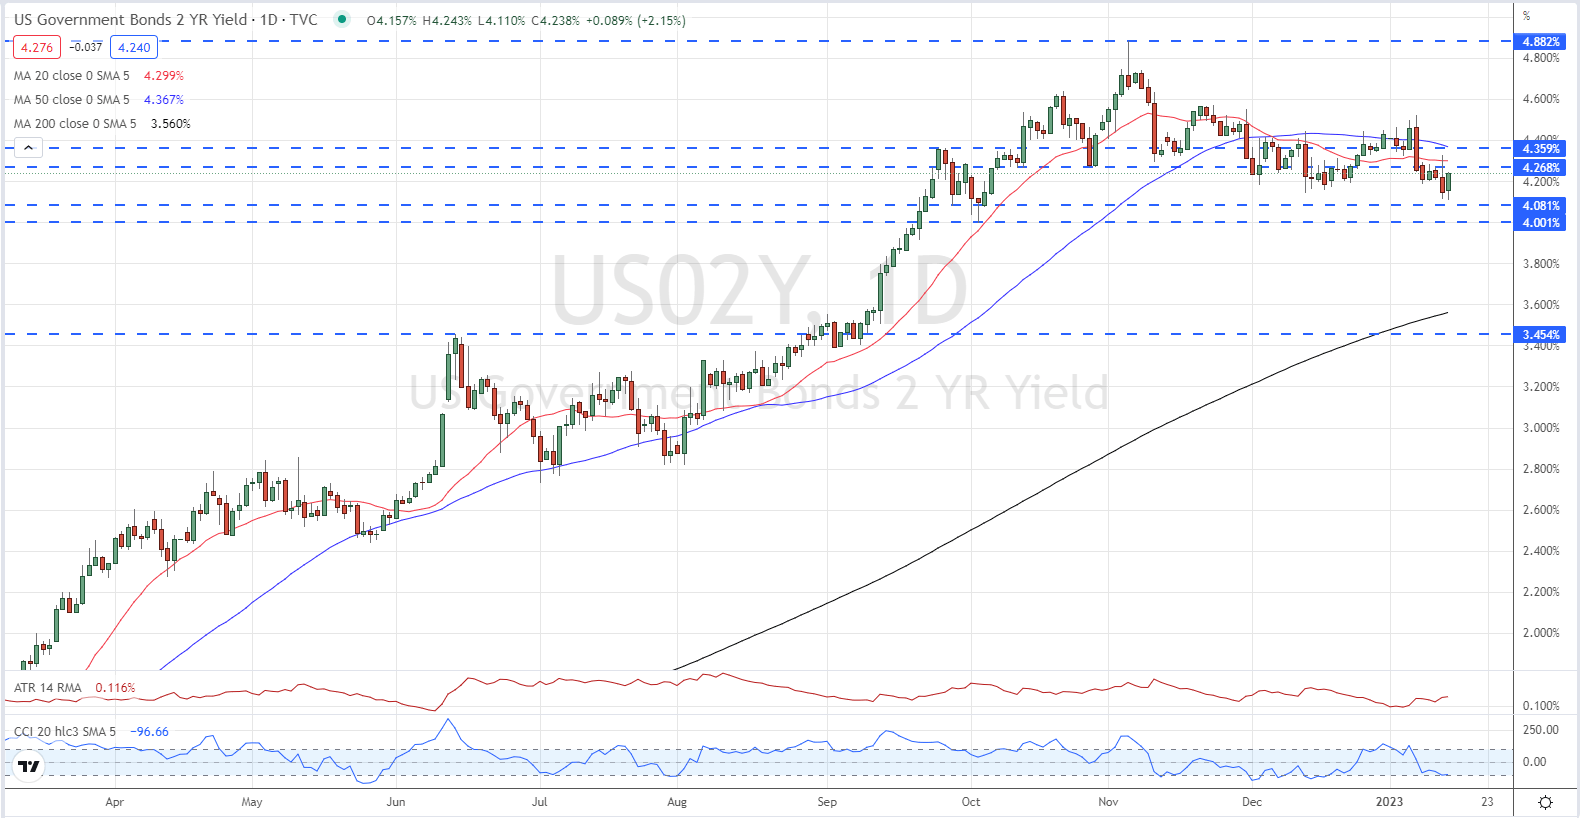
A 25 basis point interest rate hike at the February 1 FOMC is looking nailed on according to a closely watched market indicator. The latest CME FedWatch Tool is showing a 93% probability of a twenty-five basis point rate hike, compared to recent Fed talk and prior expectations of a half-point increase. With the market now pricing in a total of just 50bps of hikes this year, US bond yields have turned lower again over the last week, dragging the US dollar down.
US 2-Year Treasury Yield – Daily Chart, January 16, 2023.
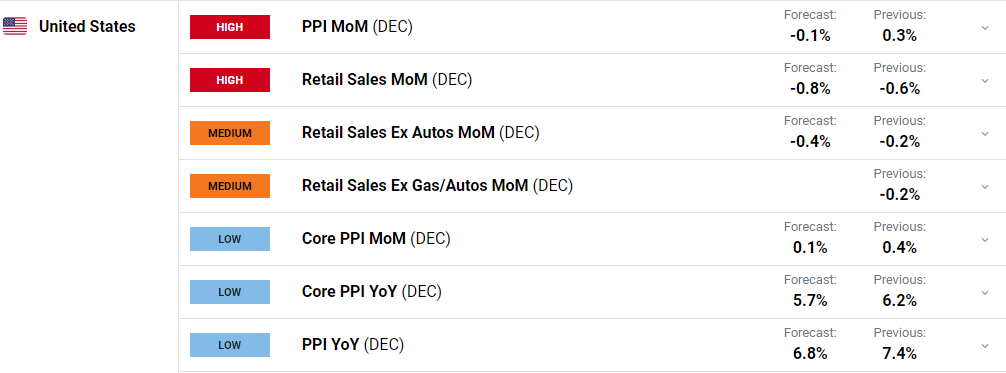
Financial markets have opened the week little changed and with the US closed for the Martin Luther King Holiday, turnover is likely to remain light. The economic calendar picks up during the week – The World Economic Forum meeting, the Bank of Japan interest rate decision, and UK/EU inflation – but one release to look out for is the monthly US PPI figures on Wednesday. While consumer price inflation is starting to fall, a fall in factory door price pressures would reinforce current thinking that inflation is moving lower across the board.
For all market-moving events and data releases, see the real time DailyFX Calendar
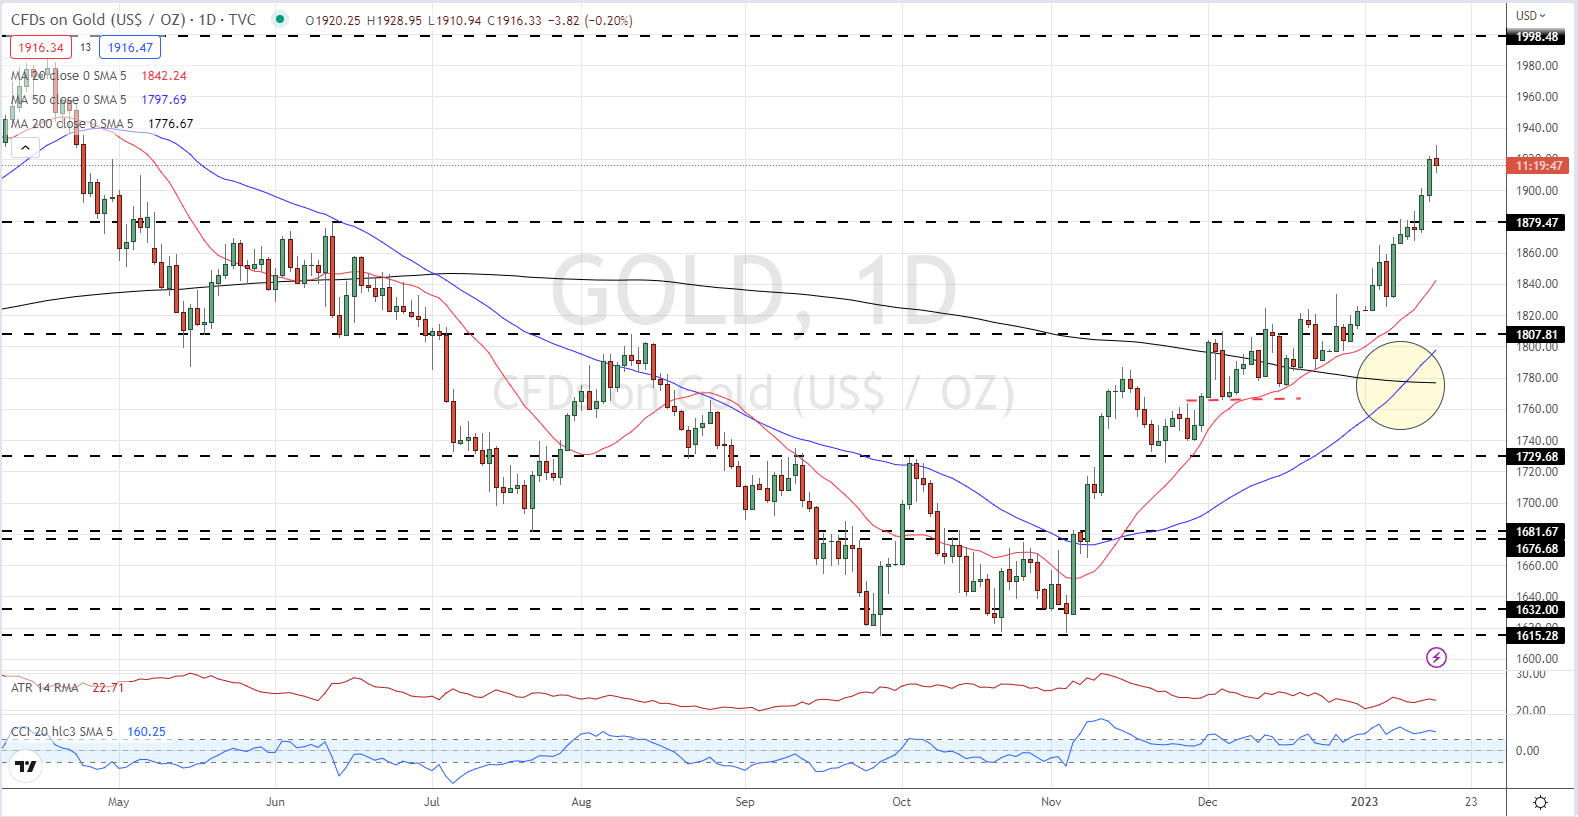
Gold has rallied by over $300/oz. over the last 10 weeks with barely any consolidation. Green candles dominate the last two-and-a-half months, with the 50-day/200-day moving average crossover adding additional momentum to the move. Unless the US inflation backdrop changes, or the Fed hikes by 50 basis points on February 1, gold is likely to test the $2,000/oz. level in the coming weeks.
Gold Price Chart – Daily Chart, January 16, 2023
Charts via TradingView
{{SENTIMENT|GC}}
Retail Traders are Undecided
Retail trader data 55.77% of traders are net-long with the ratio of traders long to short at 1.26 to 1.The number of traders net-long is 3.17% higher than yesterday and 9.38% lower from last week, while the number of traders net-short is 0.20% lower than yesterday and 13.16% higher from last week.
We typically take a contrarian view to crowd sentiment, and the fact traders are net-long suggests Gold prices may continue to fall. Positioning is more net-long than yesterday but less net-long from last week. The combination of current sentiment and recent changes gives us a further mixed Gold trading bias.
What is your view on Gold – bullish or bearish?? You can let us know via the form at the end of this piece or you can contact the author via Twitter @nickcawley1.