
In this blog we will see how we were able to forecast in advance the wave ((iii)) higher in NQ_F. Nasdaq has been one of the weakest Indices within 2022 and has been seeing a relief bounce rally as of recent. We will see below how here at Elliott Wave Forecast were able to forecast in advance the upcoming wave ((iii)) of C in NQ_F.
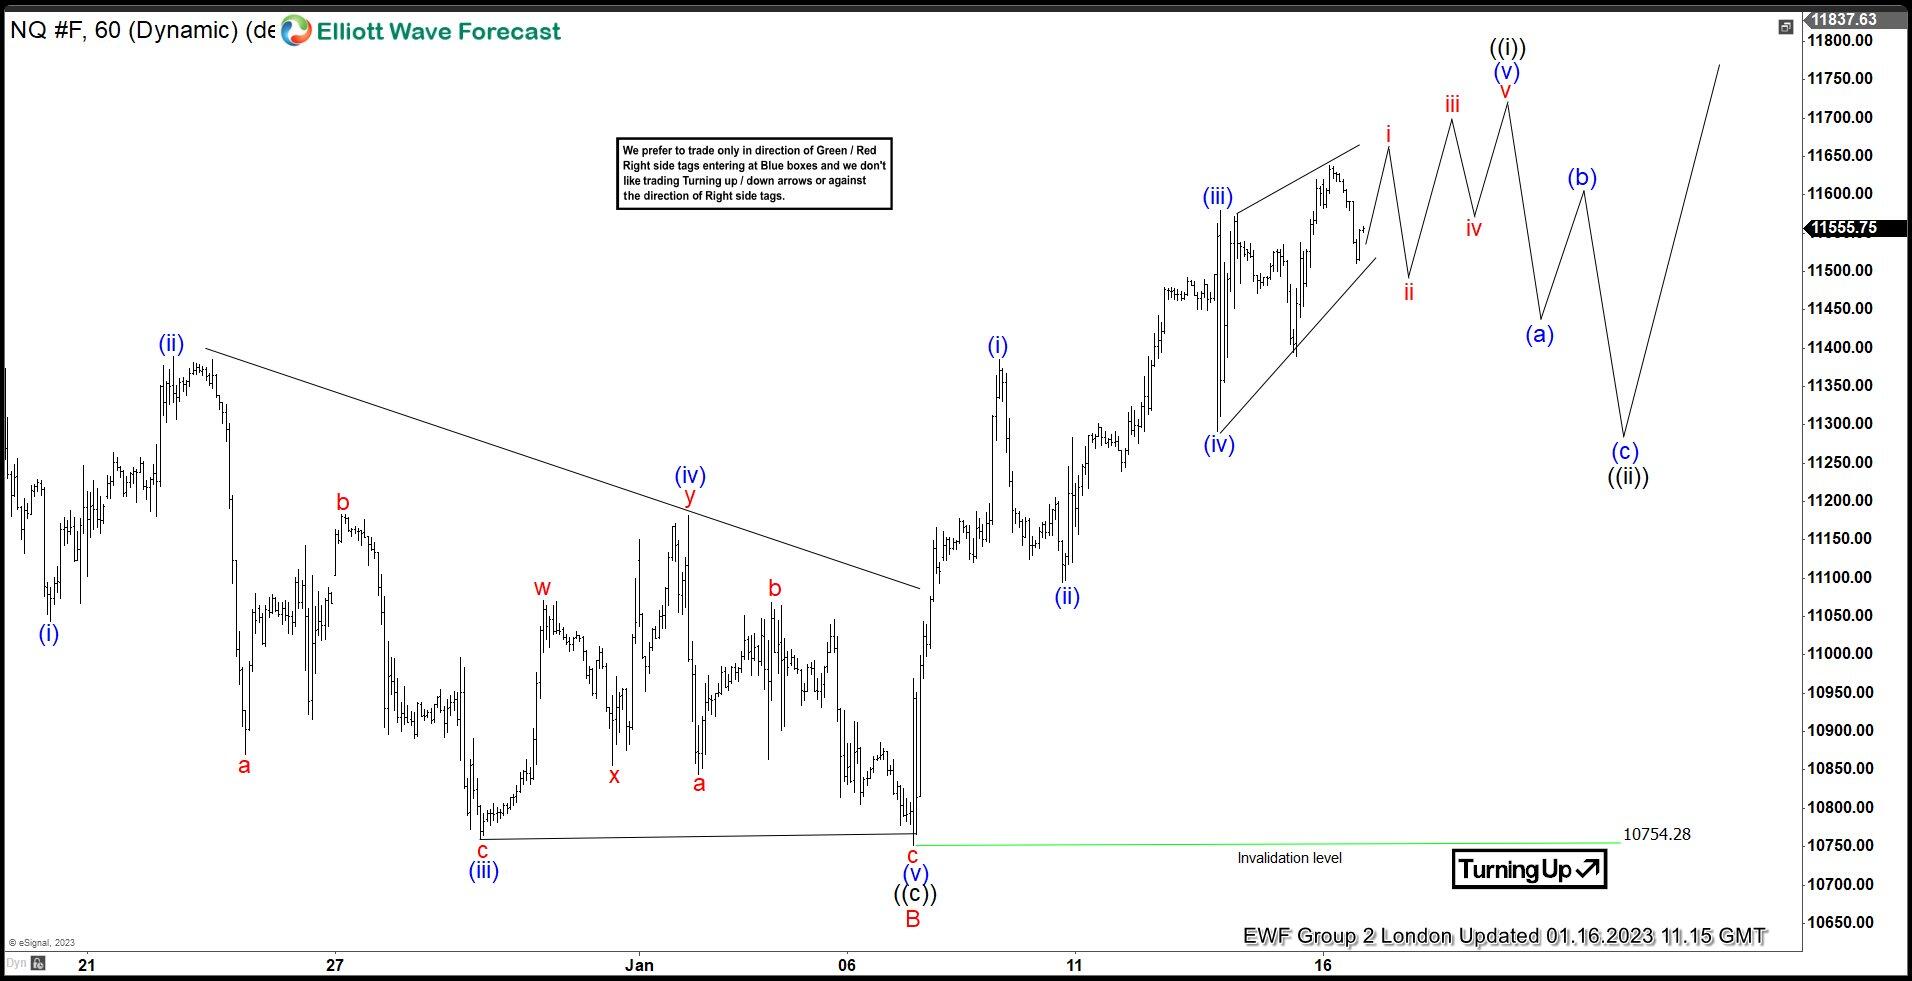
Let have a look on how we saw Nasdaq during 01.16.23. It had ended B leg at 10754.28 and since then has been showing 5 waves off these lows. Thus confirming C leg in progress. In the 1 hour cycle it is within wave i of (v) of ((i)).
NQ_F 01.16.23 1 hour London update chart
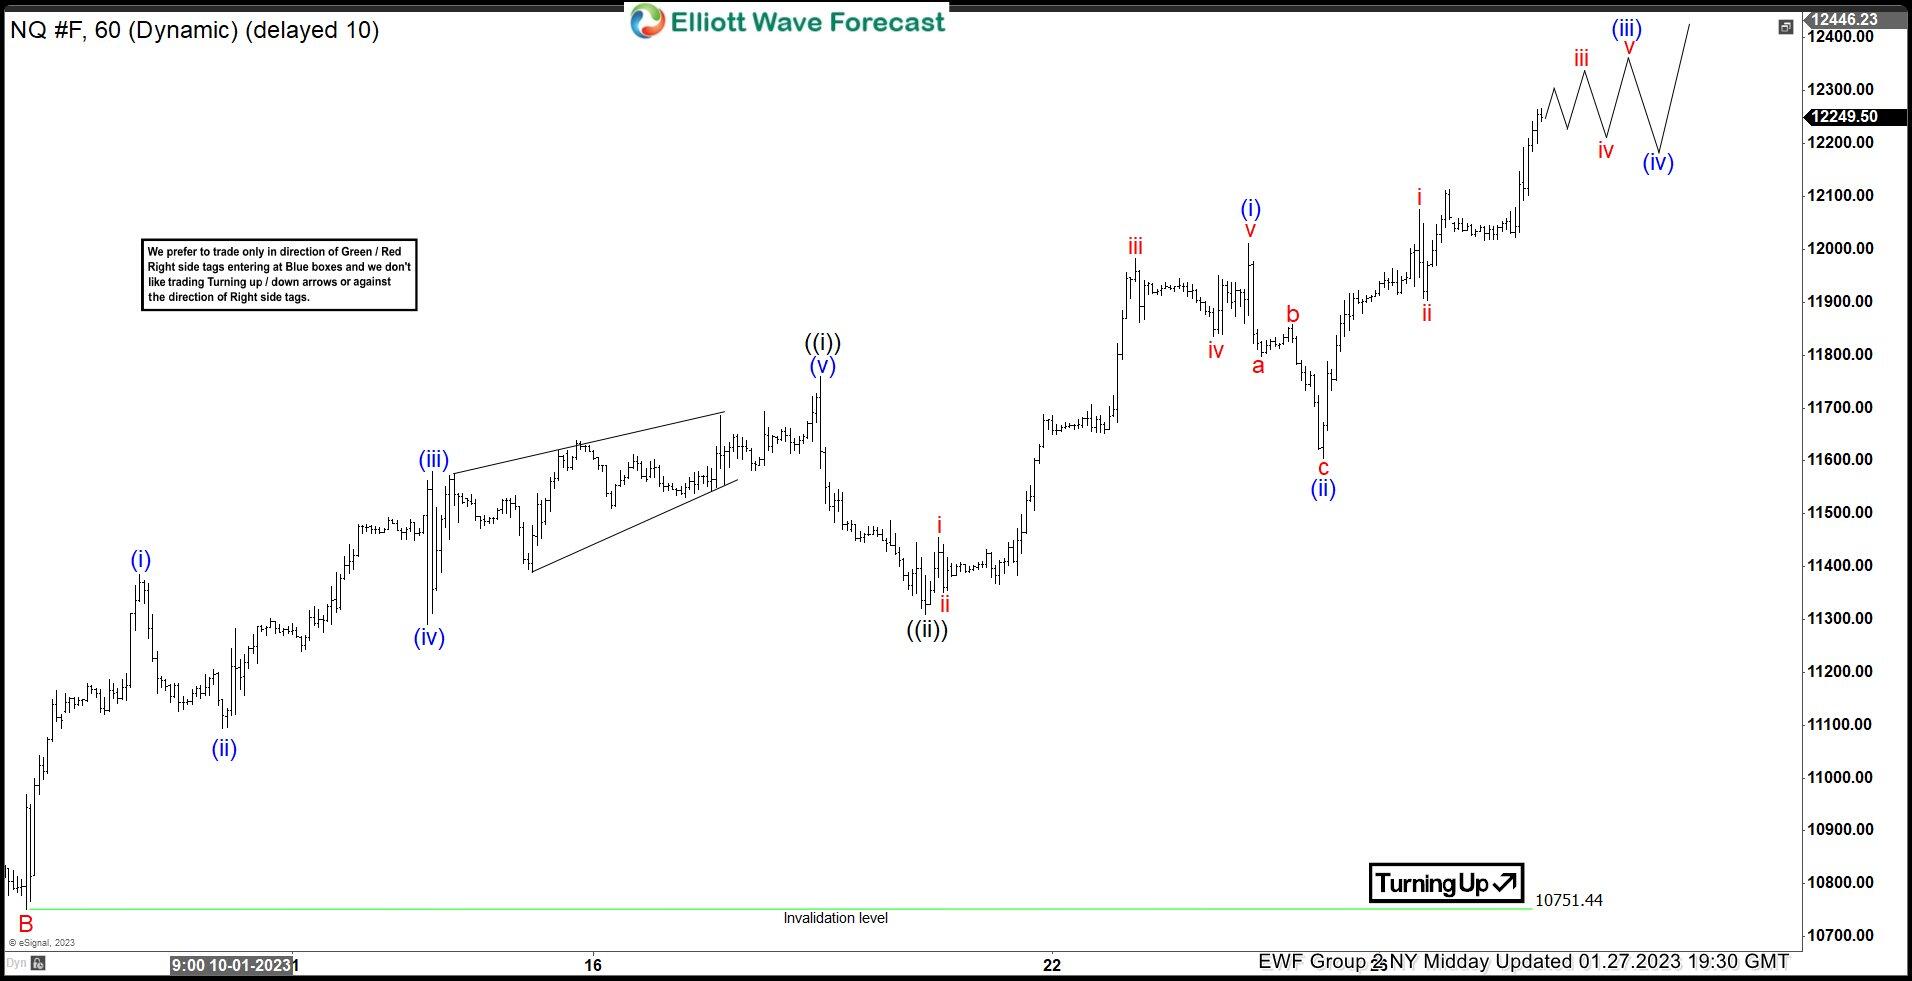
Now let’s check out our latest chart from 01.27.23. As seen it is within wave iii of (iii) of ((iii)). As we can see Nasdaq completed the pullback in wave ((ii)) and accelerated higher in wave ((iii)). With wave (i) and (ii) completed now it is trading within iii of (iii) of ((iii)). Near term, after it ends (iii) and pullback in (iv) it is expected higher in (v) of ((iii)).
NQ_F 01.27.2023 1 hour midday update
Learn more about NQ_F in near term and longer term cycles by becoming a member. Here at Elliott Wave Forecast we provide analysis of 78 instruments in which you get 4 daily updates. Asian, London, New York and NY Midday. Once a day you get a 4 hour update and once a week Daily and Weekly charts update. In addition you get the chance to attend or watch the recording of our Analysis Session and Live Trading Room. Learn how to trade the right side and learn how we analyze and see the market.