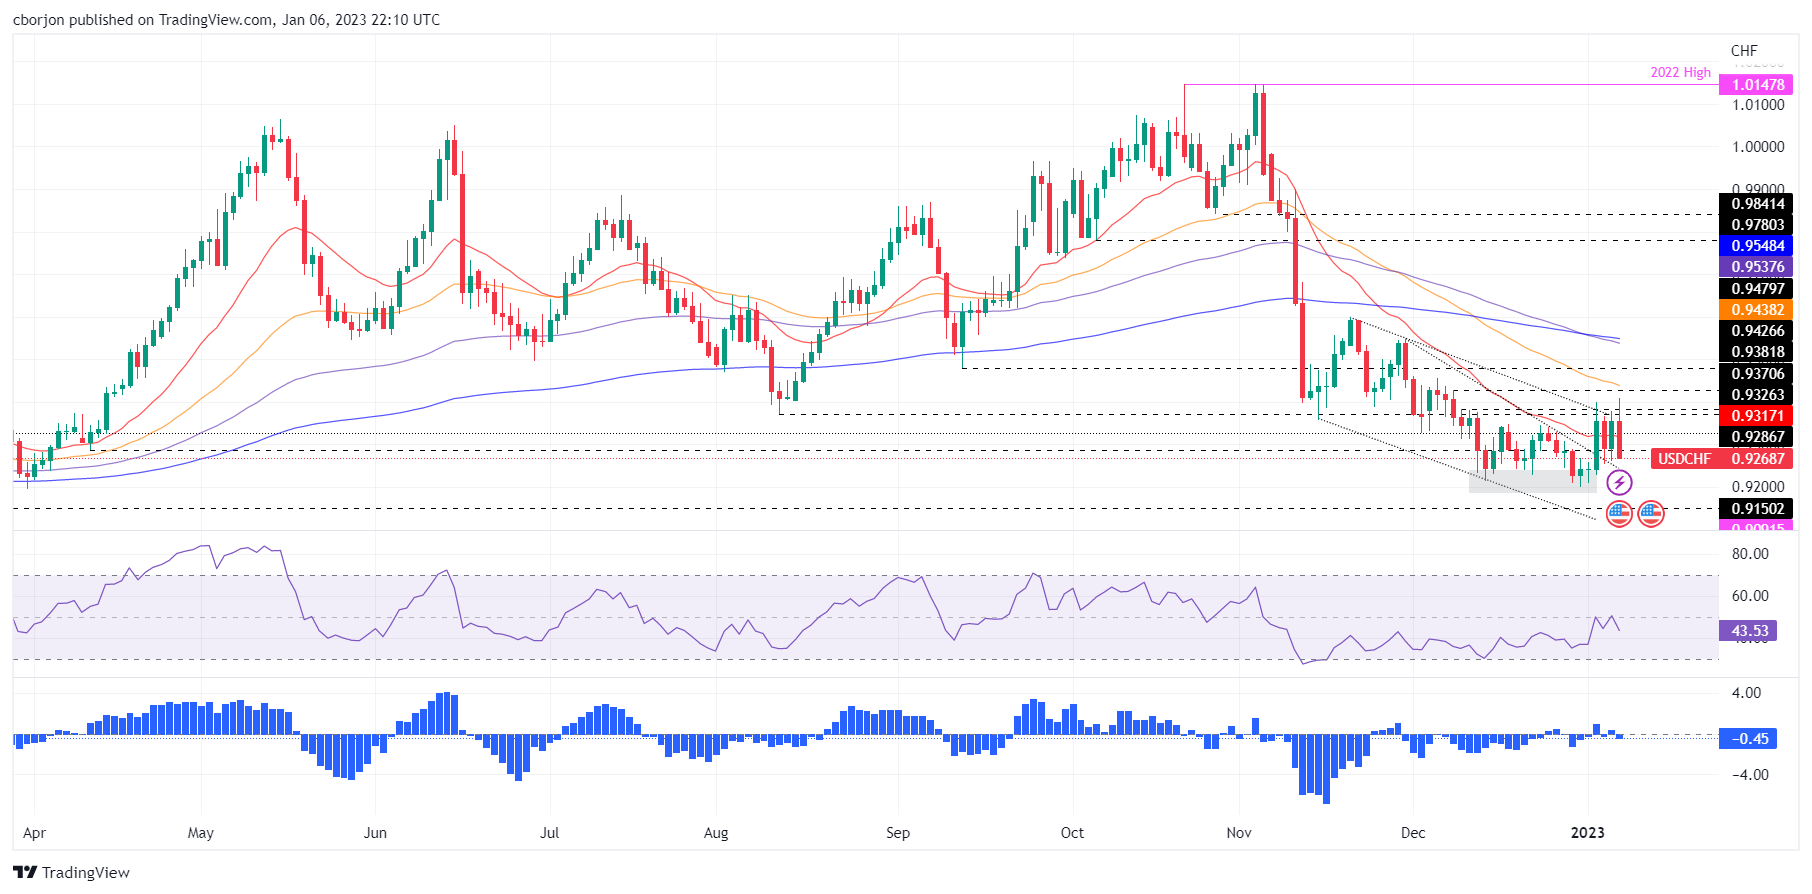
- Albeit the USD/CHF fell 1% on Friday, the pair finished the week with gains of 0.45%.
- USD/CHF remains sideways, though slightly tilted downwards, and it could test the 0.9200 mark.
- If the USD/CHF reclaims 0.9300, that could pave the way to 0.9400.
The USD/CHF plunged after hitting fresh weekly highs around 0.9408, plummeting beneath the 0.9300 figure, on mixed US economic data that triggered a sell-off in the US Dollar (USD); therefore, the USD/CHF collapsed. At the time of writing, the USD/CHF is trading at 0.9281.
USD/CHF Price Analysis: Technical outlook
From a weekly chart perspective, after hitting a weekly high of around 0.9408, the USD/CHF finished the week with gains of 0.45%. It should be said that the week ending on January 6 printed a candlestick with a significant upper wick, meaning that sellers are gathering momentum. With the Relative Strength Index (RSI) extending its fall to bearish territory and the Rate of Change (RoC) aiming lower, the USD/CHF could test 0.9200 in the near term.
The USD/CHF daily chart portrays the pair as downward biased, though consolidating and unable to crack the 0,9200 mark. Following the upbreak of a falling wedge, the USD/CHF failed to gain traction and got trapped around the 0.9250-0.9400 mark.
Oscillators like the Relative Strength Index (RSI) shifted gears, turning bearish, while the Rate of Change (RoC) suggests that sellers outpaced buyers.
Therefore, the USD/CHF first support would be the falling wedge top-trendline which turned support at 0.9240, followed by the 0.9200 mark. Break below, and the USD/CHF might fall toward the 2022 low of 0.9091. On the flip side, the USD/CHF first resistance would be the 0.9300 mark. Once cleared, the next resistance would be January’s 6 high of 0.9408, followed by the 50-day Exponential Moving Average (EMA) at 0.9438.
USD/CHF Key Technical Levels

