
USD/JPY Analysis
- Risk assets rally after FOMC on encouraging disinflation admission, appearing to ignore the warnings that accompanied it
- Narrowing rate differential suggests USD/JPY trend continuation
- USD/JPY technical analysis and levels to watch ahead of NFP data
- The analysis in this article makes use of chart patterns and key support and resistance levels. For more information visit our comprehensive education library
Recommended by Richard Snow
See what our analysts foresee in the yen for Q1
Risk Assets Rally After FOMC Inflation Admission
Jerome Powell had a lot to say during the press conference after last night’s FOMC decision to hike the Federal Funds rate by 25 basis points. He stressed that inflationary risks remain despite encouraging disinflation witnessed in most sectors. Powell was rather forthcoming in the presser and referred to his dissatisfaction with ‘core services ex-housing’, which is yet to ease in a satisfactory manner.
Risk assets witnessed an immediate rise after the address while the US 10-year treasury yield and the dollar continued to move lower as rates markets continue to bet against the Fed, anticipating an end to restrictive monetary policy before the Fed does.
Asset Performance After FOMC: Gold(yellow), Bitcoin (orange), DXY (green), US 10-year yield (red)
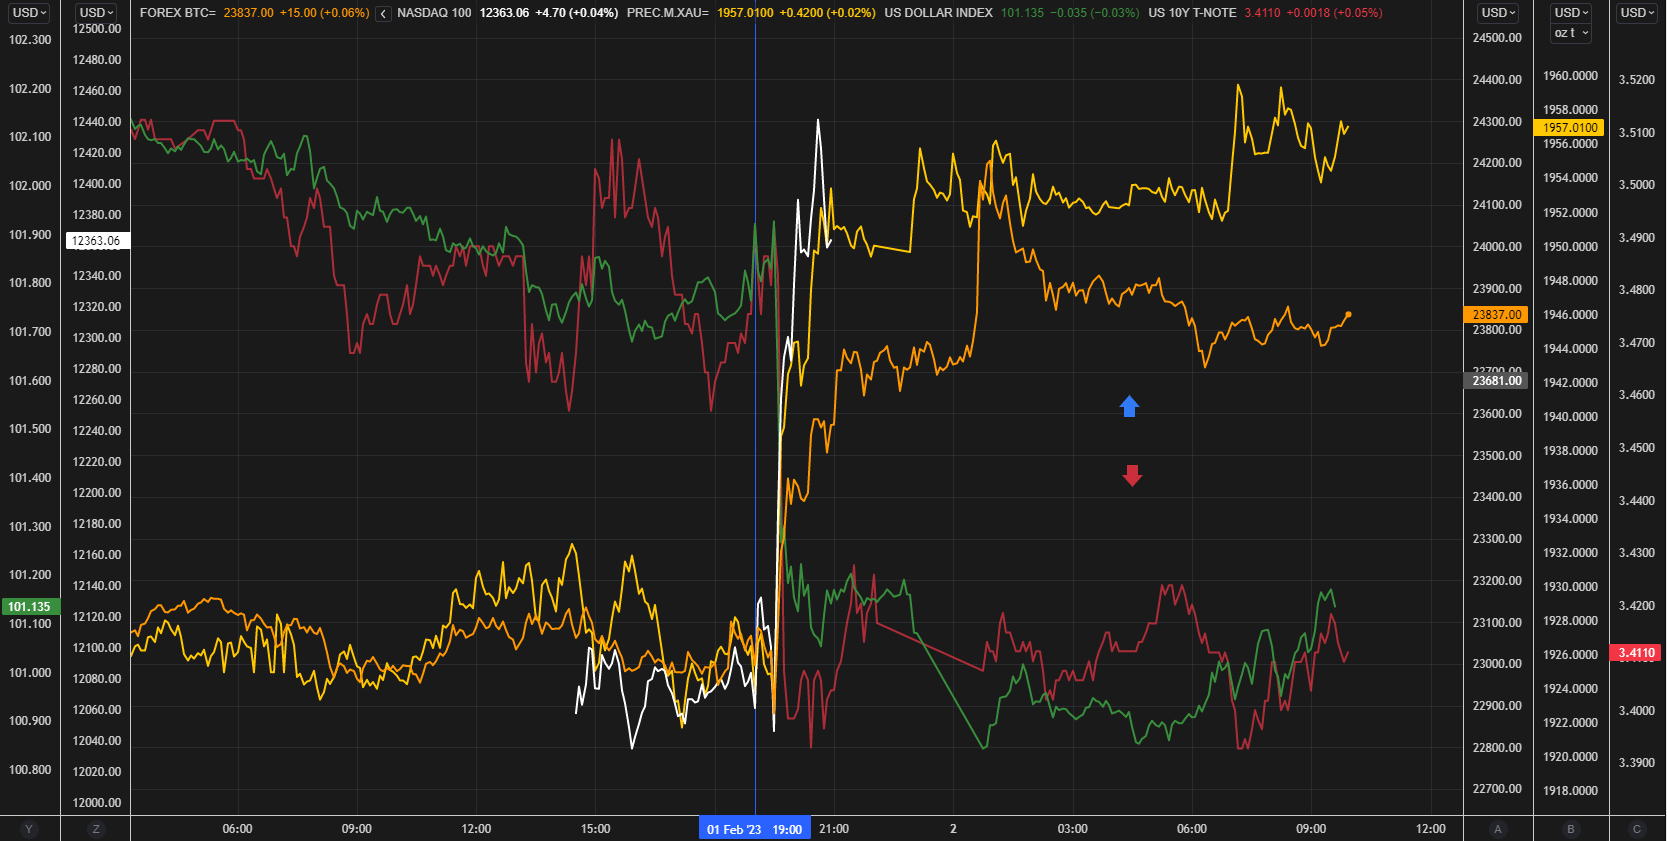
Source: Refinitiv, prepared by Richard Snow
Narrowing Rate Differential Suggests USD/JPY Trend Continuation
As markets anticipate lower interest rates as early as the second half of this year, bond yields received another nudge lower. With the Bank of Japan holding the 10-year government bond yield at 0.5%, the declining US equivalent continues to narrow the rate differential, which speaks to a bearish continuation in USD/JPY.
USD/JPY Daily Chart (blue) with Rate Differential (Black) Compared
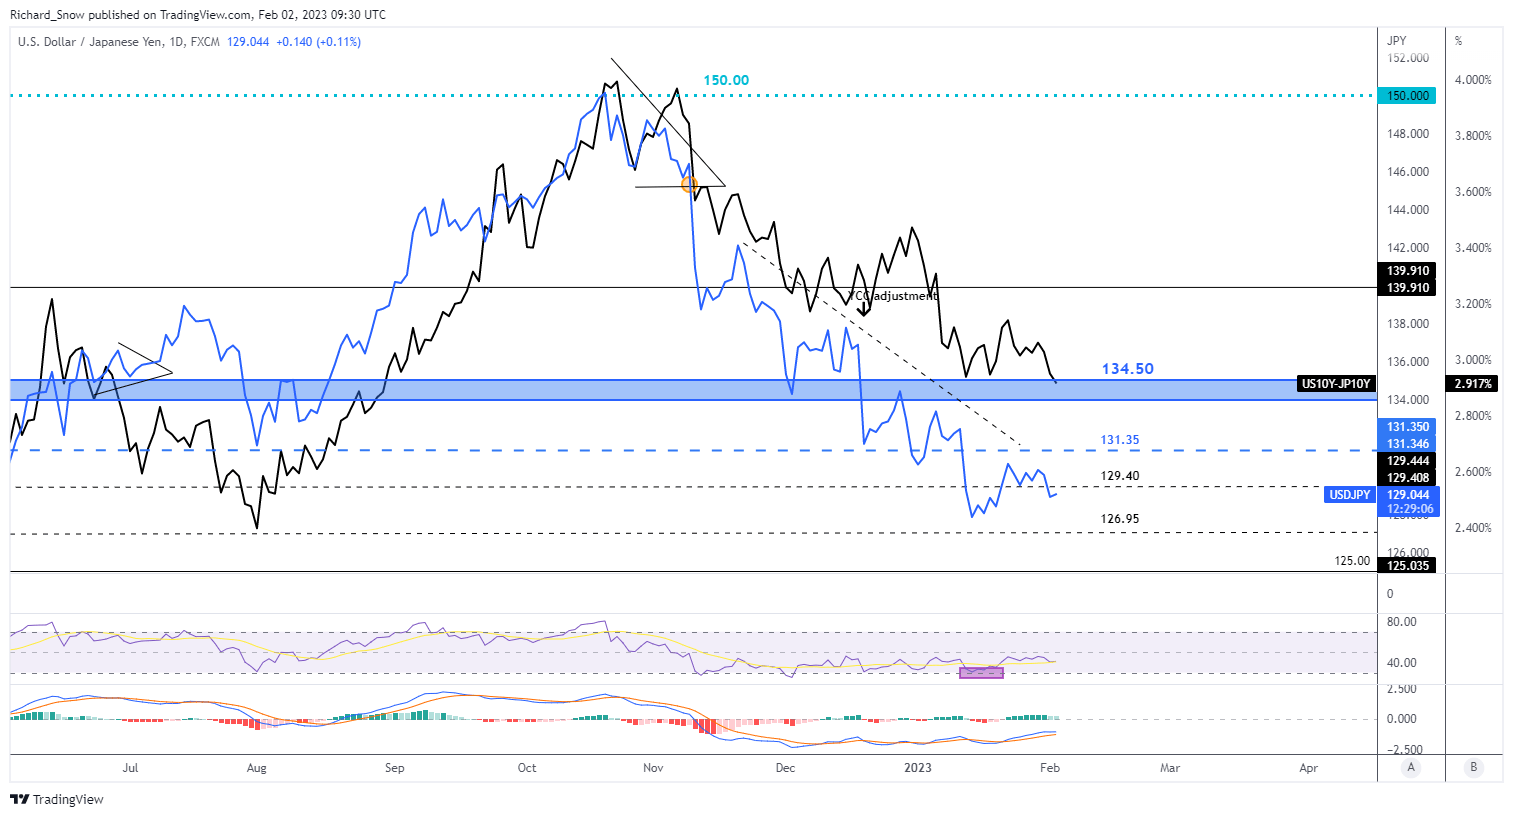
Source: TradingView, prepared by Richard Snow
USD/JPY Technical Analysis
Ahead of the FOMC event, USD/JPY traded higher, towards the down sloping trendline resistance and turned lower thereafter. The magnitude of the move, in comparison with other major FX fairs against the dollar, was rather muted – perhaps indicative of the massive declines we have already seen.
The MACD reveals upside momentum has not yet shifted and price action this morning appears flat. Greater conviction of a bearish trend continuation is achieved should we trade below the January low and the 127.00/126.95 level. Resistance neatly resides at the intersection of the trendline resistance and the 129.40, followed by 131.35.
USD/JPY Daily Chart
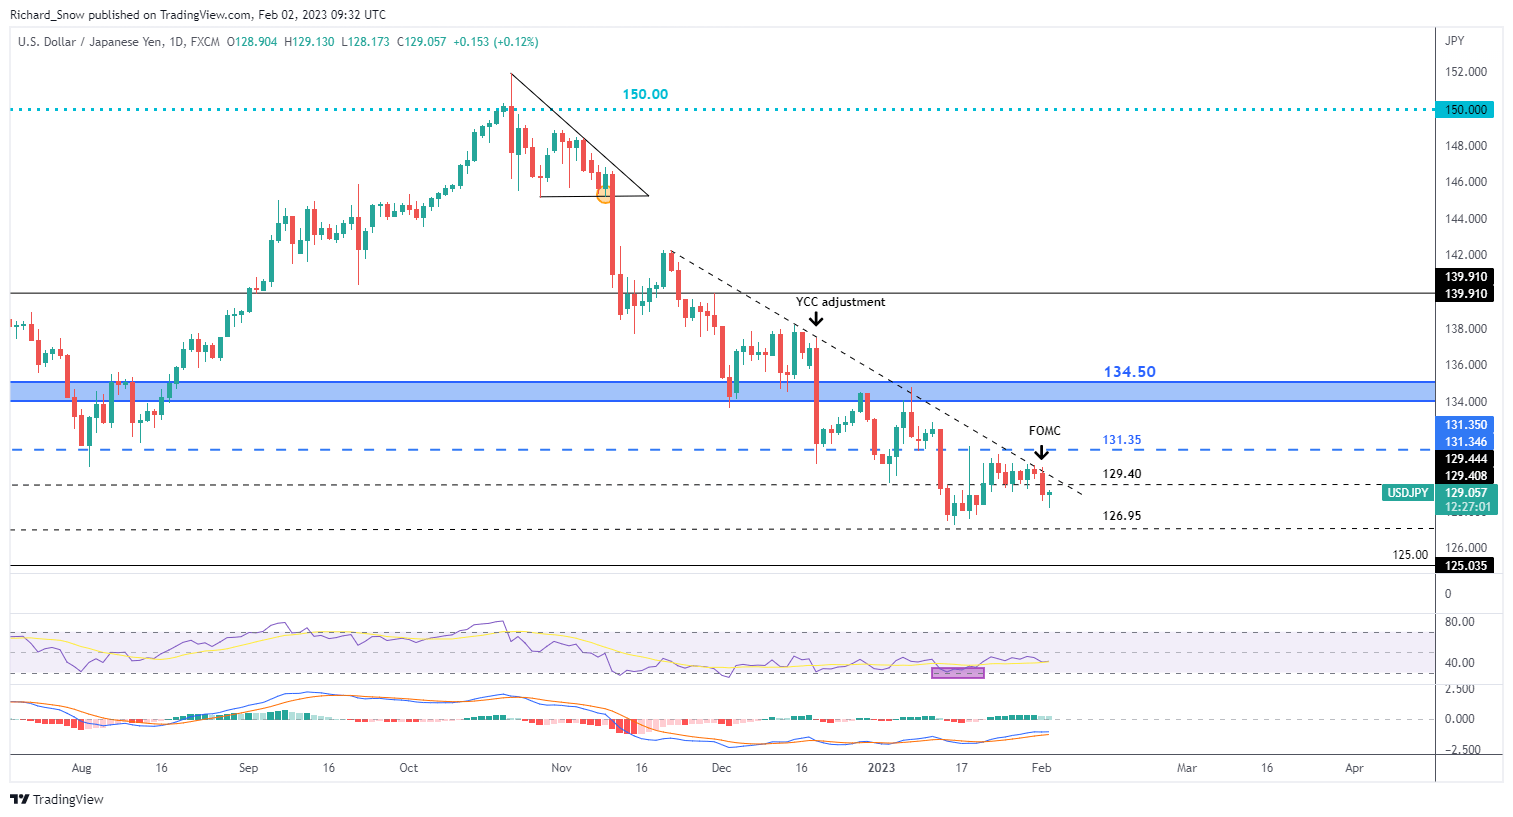
Source: TradingView, prepared by Richard Snow
Recommended by Richard Snow
Building Confidence in Trading
There is still plenty of event risk ahead this week as non-farms and a major sentiment indicator are due for release on Friday.
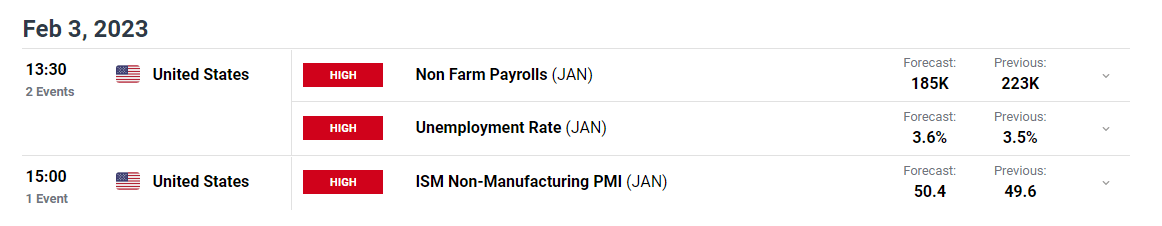
Customize and filter live economic data via our DailyFX economic calendar
— Written by Richard Snow for DailyFX.com
Contact and follow Richard on Twitter: @RichardSnowFX