- GBP/USD retreats from intraday high to pare the biggest weekly gain since late November.
- RSI pullback from nearly overbought conditions adds strength to the pullback moves.
- 200-SMA, weekly support line appears crucial challenge for bears.
- UK monthly GDP, output and trade numbers for November will be crucial to watch.
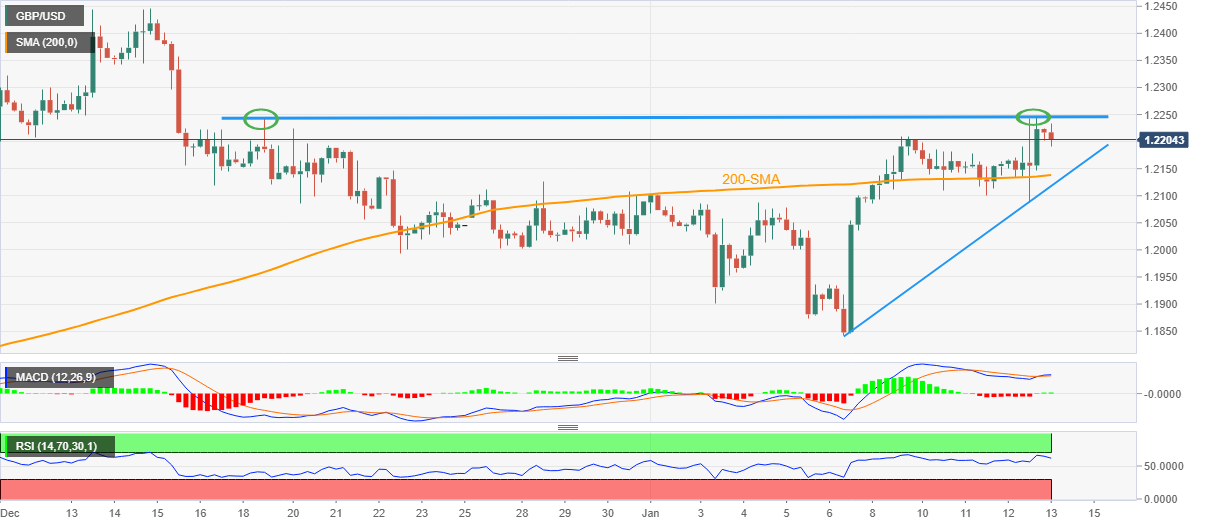
GBP/USD prints mild losses around 1.2200 as bulls take a breather at the monthly high ahead of the key UK data on early Friday. In doing so, the Cable pair consolidates the biggest weekly gains in six while printing the double top bearish chart formation on the four-hour play.
Also read: GBP/USD picks demand around 1.2200 as risk appetite improves further
Additionally, teasing the GBP/USD bears could be the sluggish MACD signals and the RSI (14) retreat from the nearly overbought region.
However, the 200-SMA and an upward-sloping trend line from January 06, respectively near 1.2140 and 1.2115, appear tough nuts to crack for the GBP/USD pair sellers.
Following that, a downward trajectory toward the monthly low of 1.1841 can’t be ruled out.
It’s worth noting that the GBP/USD weakness past 1.1841 will confirm the “double tops” and will theoretically signal a south-run to 1.1440.
Alternatively, an upside clearance of the 1.2250 level will defy the bearish chart pattern, which in turn will direct GBP/USD buyers towards the previous monthly high surrounding 1.2445-50.
In case where the Cable pair remains firmer past 1.2450, its run-up towards May 2022 high near 1.2665 can’t be ruled out.
GBP/USD: Four-hour chart
Trend: Further downside expected

