
WTI PRICE, CHARTS and ANALYSIS:
Recommended by Zain Vawda
Get Your Free Oil Forecast
WTI FUNDAMENTAL OUTLOOK
Crude Oil has had a difficult week despite broad-based US Dollar weakness for the majority of the week. WTI hit a fresh three-week low yesterday and remains on course for a second week of losses as sanctions on Russian oil products loom.
There have been a host of factors that could be attributed to the decline in oil prices this week. Oil inventories in the US rose to their highest level since June 2021 with the Energy Information Administration also showing an increase in inventories of oil-based products. EIA oil stocks change for the week ended January 28 rose by 4.14M versus 0.376M expected.
Recommended by Zain Vawda
How to Trade Oil
As China’s reopening continues the optimism around demand has yet to come to fruition while inventories continue to grow. Data out of China this week was mixed with the NBS Manufacturing PMI coming in above the 50 mark while the Caixin Manufacturing PMI missed estimates coming in at 49.2, remaining in contractionary territory. Overnight we did have some more positive data however, as Caixin composite PMI came in at 51.1 up from 48.3. Looking ahead we still need to see a continuous improvement in Chinese data and actual demand improve which may offer renewed support for oil prices.


For all market-moving economic releases and events, see the DailyFX Calendar
The OPEC+ meeting this week saw the JMMC recommend that production remain steady with Chinese demand yet to materialize. Members of the group agree that keeping the current agreement in place until the end of 2023 should keep markets stable. The current OPEC+ President Gabriel Mbaga Lima said the group had to be careful on any decision while Secretary General Haitham Al-Ghais remains cautiously optimistic in regard to the global economic recovery.
Discover what kind of forex trader you are

The FOMC meeting this week saw a weaker dollar as the Fed signaled progress with Fed chair Powell using the word ‘disinflation’ which seemed to give risk assets a boost. The positivity in sentiment toward risk assets has likely contributed to the decline in oil prices as market participants flock back into equities, with many stocks and indices trading at discount levels following 2022’s rout.
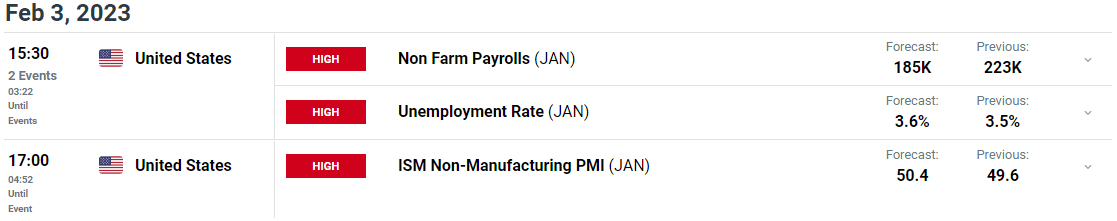
Later today we have a batch of high impact data out of the US with the NFP release likely to have an impact with average hourly earnings also key as a contributing factor toward the inflation fight.
For all market-moving economic releases and events, see the DailyFX Calendar
TECHNICAL OUTLOOK
From a technical perspective, WTI is on course for a second week of losses. The daily timeframe has seen price action shift bearish following a daily candle close below the previous lower swing high around the $79 a barrel mark. We have found some support since with price currently sitting above the $75 a barrel handle. Key support area rests around the $73 mark with a close below potentially opening up a retest of the 2022 low around the $70 handle.
Alternatively, a run up for WTI faces resistance in the form of the 50-day MA resting at $77.50 and above that the 100-day MA around the $81.45 handle.
WTI Crude Oil Daily Chart – February 3, 2022

Source: TradingView
IG CLIENT SENTIMENT DATA: BEARISH
IGCS shows retail traders are currently Long on Crude Oil, with 79% of traders currently holding long positions. At DailyFX we typically take a contrarian view to crowd sentiment, and the fact that traders are long suggests that Crude Oil may continue to fall.
Written by: Zain Vawda, Market Writer for DailyFX.com
Contact and follow Zain on Twitter: @zvawda