
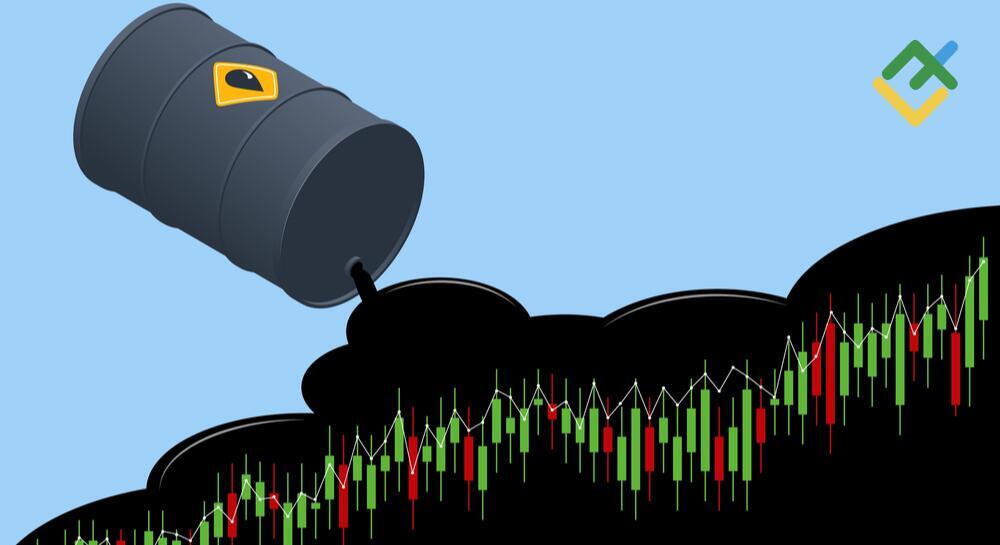
The oil price is an important indicator of the economy. Oil is the most used resource in the world; many wars have raged over black gold. The cost of crude oil is closely monitored by everyone – especially since the corona crisis; many investors are looking for the price expectations for the coming period. After reading this article, you will be aware of all developments in this exciting sector. We’ll discuss our oil price expectations for 2021 and beyond. We’ll also discuss the oil brands Brent and WTI, in particular, as we go in-depth on the history of this commodity and look at the oil price forecast.
The article covers the following subjects:
Oil Brands
When talking about the commodity oil traded on the financial markets, we can distinguish two types. The most popular, and also the most traded, is the American oil called WTI. The other popular variant is Brent.
West Texas Intermediate (WTI)
Light sweet crude oil (WTI) is widely used in US refineries and an important benchmark for oil prices. WTI is a light oil with a high API density and low sulfur content. This determines the density of the oil in relation to water. WTI oil is widely traded between oil companies and investors. Most trading is done through futures through CME Group. The Light Sweet Crude Oil (CL) future is one of the most traded futures worldwide.
Most of the oil of this type is stored in Cushing, an important hub for Oklahoma’s oil industry. Here are large storage tanks connected to pipelines that transport the oil to all United States regions. WTI is an important feedstock for refineries in the Midwestern United States and on the coast of the Gulf of Mexico.
Brent Crude Oil
Brent oil is an important benchmark for petroleum rate, especially in Europe, Africa, and the Middle East. Its name is derived from the Brent oil field in the North Sea. This Royal Dutch Shell oil field was once one of Britain’s most productive oil fields, but most of the platforms there have since been decommissioned.
The correlation between these two futures’ price development is high, and we have seen several times in recent years that Brent’s price was more than $10 higher than usual. At the end of 2020, the difference was approximately $3. Such differences are caused, among other things, by supply and demand, including the costs for shipping or storing oil.
A Recent History of Oil
At the end of April 2020 (due to the Saudi and Russia conflict – more on that later), the oil price crashed, and the May WTI future even dipped below $0. The stock markets recovered strongly during the summer, and the oil price had also found its way up again. In August, the oil price rose well above $ 40 a barrel. With that price, the largest oil companies got some air also, but it is still far from enough for most to make a profit.
At the beginning of September, the oil price had suddenly fallen hard again. Simultaneously, with the mini-crash with the US stock markets, a crude oil barrel’s worth dropped by about 15% to below $37 a barrel. This brought the oil price back below $40 a barrel for the first time since July. The drop is partly because Saudi Arabia had lowered its sales prices for October and the fear that the number of COVID-19 infections will increase rapidly in several countries.
The rebound in the number of infections could thwart the global economic recovery and decrease fuel demand. With several refineries lowering tariffs again, it seems they want to prevent oil stocks from rising back to record levels. The oil price was able to recover so strongly in recent months, thanks to the OPEC + countries’ agreements regarding the reduction in production. However, due to the crisis, many countries are looking for additional income sources. Therefore, some countries are not fully complying with the agreements made. As a result, more oil flows into the market, which also has a depressing effect on oil prices.
March 9th, 2020: 30% Oil Price Crash
Monday, March 9th, can go into the history books as “Black Monday” for the oil price. Negotiations between Saudi Arabia and Russia had come to nothing.
The oil price was under pressure in previous months due to the spread of the coronavirus. The world economy was on the back burner, and as a result, the oil demand had declined considerably. By limiting oil production, the countries that are part of the oil cartel hoped to stabilize or increase the price themselves. Saudi Arabia, in particular, is strongly in favor of limiting oil production.
Saudi Arabia was now trying to force Russia in another way to join the OPEC plan. The Saudi’s were going to increase production considerably and flood the market with oil. As a result, the price of a crude oil barrel had opened more than 30% lower, the lowest price since 2016. A low oil price is disastrous for most countries. Most OPEC countries are almost entirely dependent on oil revenues.
America’s shale farmers may be hit hardest. The shale revolution seems to be built more and more on quicksand, as costs remain high and the new resources that are found have a much shorter lifespan. Even with an oil price of around $60 a barrel, many of these producers were already struggling. The unrest surrounding the coronavirus also makes it difficult to raise external capital. With Saudi Arabia pushing the oil price further down, the situation seems to be untenable for many producers. Players with a fragile balance and relatively high costs are unlikely to make it. What Saudi Arabia failed to achieve in 2016 now seemed to have a good chance of success.
April 21st, 2020: WTI Goes Below Zero
In April 2020, we saw a situation in the oil markets that has never occurred before. The West Texas Intermediate Crude Oil (WTI) futures contract for May fell more than 100%. The price fell during the day and took an unprecedented dive later in the evening to $ -37.63/barrel, meaning that oil producers would indeed have to pay buyers to collect the oil.
This is mainly because the storage capacity in Cushing, Oklahoma is full. And it is precisely there that this oil is delivered. Traders and large companies who were long yesterday but ran out of storage capacity or liquidity to purchase oil were forced to close futures before expiry.
Shale Oil Influence
Oil production increased rapidly, and OPEC was not happy about this. They saw the increase in supply in the Middle East as competition. OPEC, therefore, came up with the idea of fully opening the oil taps. The production costs of shale oil were many times higher. The result was a drop in oil prices from about $110 a barrel to below $30 at the beginning of 2016. OPEC hoped to wipe out shale farmers in this way.
This strategy failed, and the OPEC countries themselves ultimately suffered considerable disadvantages from this strategy. For years they saw their income more than halved. In the meantime, the shale farmers have learned to work cheaper and more efficiently, and they are already profitable at a lower oil price. What’s typical of this form of oil extraction is that production can be increased quickly.
OPEC Influence
Demand for oil will remain stable in the coming years. But it is also apparent that there is a lot of extra supply on the market now that American oil production is rapidly increasing. Shale oil, in particular, is extracted from the ground here. The shale revolution was set in motion in 2014 by the sharp rise in oil prices. This form of oil extraction was therefore profitable, despite the high production costs. Due to the attractive market, the oil companies sprang up like mushrooms.
OPEC is trying to limit production to keep the oil price at a reasonable level. Most countries benefit from a somewhat higher, but in any case, stable, oil price. According to OPEC, the oil industry must invest more than $11,000 billion over the next 20 years. If producers don’t do that, there will be a shortage. In principle, shale farmers have already invested enough in recent years to absorb a large part of these shortages.
Furthermore, OPEC states that demand continues to increase despite the emergence of electric cars and the like. OPEC writes that the massive expansion of air travel creates a greater demand for oil than the emergence of alternative energy sources can diminish.
Since the low oil price in 2016, OPEC has been trying to support the low oil price. This is done by agreeing on production restrictions with all countries that are members of OPEC. The agreements do not always go smoothly, as Iran and Iraq do not always adhere to these agreements. On the other hand, the US and other countries continue to produce more and more oil, putting oil prices under pressure for a long time.
Oil Price Today
At the time of writing (December 21, 2020), the price of WTI Crude Oil was 47.44 USD/barrel, while Brent Crude Oil was selling for 50.61 USD/barrel.
Source: Bloomberg
The oil price for today is $78.444. The chart below is interactive, so you can easily see the dynamics.
Experts Predict: What is long-range forecast for crude oil price?
The global oil demand will be about seven million barrels per day higher next year than this year. That is predicted by the oil-producing countries, which collaborate in OPEC, in a published report with expectations for 2021.
This increase is unprecedentedly large but can be explained by the fact that oil demand is now very low due to the corona crisis. The upward path will be resumed next year, according to the expectations of the oil-producing countries. OPEC notes that this will only happen if there are no negative global developments by 2021, such as a new wave of corona infections and a flaring trade war between China and the United States.
This year, the oil price took a nosedive. The reason for this was the sharp fall in demand for oil, which fell by a third. The cause was, of course, the COVID-19 pandemic and the subsequent lockdown measures worldwide. Even according to OPEC’s optimistic scenario, oil demand would not return to 2019 levels next year. The increased popularity of working from home is partly responsible for this.
The corona crisis ensured that production was stopped for a long time. As a result of the corona measures, production was (temporarily) restricted. This also impacted the oil market because the production activities are of great importance to the oil sector. After all, many production companies use oil during their production process. As a result, a large part of the oil demand fell. Air and road traffic was also largely at a standstill, leading to declining demand for oil.
Despite these negative aspects, Goldman Sachs sees the oil future as rosy. For example, the below chart from Goldman Sachs shows the forecast for the oil price. The American investment bank expects a barrel of Brent oil to rise towards $65 in 2021. Calculated from the current price, this means a price increase of almost 50%.
According to Goldman Sachs analysts, oil demand will largely recover due to the improving global economy. This picture is already visible, particularly in Asia. The American investment bank also expects OPEC to stick to the oil measures for a long time. These measures ensure that the balance between supply and demand in the oil market is maintained.
US Crude Oil Technical Analysis
I always do a technical analysis of at least three time frames to make a realistic oil forecast. First, we’ll analyze the US Crude‘s price movements on the monthly chart.
The chart above provides the WTI oil market‘s 2013 – 2021 price history.
A strong resistance level of 73.80 USD was formed in June 2018. The US Crude value has come close to that level, but the buyer has failed to settle above it so far. If sellers win, the nearest support level will be at around 26.20 USD.
On the whole, the chart points to a descending potential of the US Crude price.
Now let’s switch to Fibonacci ratios. The US Crude‘s price chart above displays five areas outlined for a bearish trend according to Fibo ratios. Each of the areas features a specific price pattern:
-
Area 1 – a trend base. The price’s return to this area will indicate a possible change in the price direction.
-
Area 2 and 3 – consolidation areas. The price is highly likely to get stuck in those areas for a long time.
-
Area 4 – trend development area characterized by high market volatility.
-
Area 5 – area of peak values.
A trend may have numerous consolidation and trend development areas, but only one area 1 and 5.
WTI Crude Forecast For Next Three Months
The price is in the first area, testing the trend’s limit. A breakout will point to a possible change in the oil market’s trend, and the whole bearish formation may be canceled.
The resistance level of 73.80 USD mentioned above hinders the further growth of WTI oil as well. The price looks stuck within the limits of the first area, and a breakout to the upside looks hardly possible.
The price will most likely consolidate in a narrow range of 65 – 74 USD and then move into a downward range of area 2. It will be held up there until the end of the year at least.
The MACD confirms the bearish correction too. The chart above shows a cascade of the histogram’s divergences with the price chart. At the same time, the MACD’s moving averages show a bearish crossover for the second time and are directed down.
That’s a clear bearish signal for a weekly TF chart. So, based on the Fibonacci ratios, we can presume the bearish potential of oil is at around 50 US dollars.
Long-Term US Crude Analysis for 2021/2022
The analysis of oil price history over the past years shows a strong support area in the range of 42.10 – 34.25 USD. A more realistic forecast suggests a price move to consolidation area 3 in the long term. A future oil price might then reach the buyer’s blue area marked in the chart.
Will the oil price’s projected fall stop afterward? It’s hard to say for now as everything will depend on the buyer’s reaction to the level of 35 USD. If bulls fail to resist a bearish attack, the price may sink to the historical low of 34.1 USD. It’s towards the end of the next year that we’ll understand whether or not such a fall is possible.
To calculate the US Crude (WTI) expected trading range, I used Bollinger bands.
The result is displayed in the chart above and the table below.
|
Month |
US CRUDE price |
|
|
Minimum |
Maximum |
|
|
August 2021 |
65.00 |
73.53 |
|
September 2021 |
61.90 |
71.00 |
|
October 2021 |
59.30 |
68.50 |
|
November 2021 |
56.65 |
65.75 |
|
December 2021 |
51.80 |
60.85 |
|
January 2022 |
46.85 |
56.05 |
|
February 2022 |
43.45 |
52.60 |
|
March 2022 |
45.10 |
54.30 |
|
April 2022 |
46.80 |
55.90 |
|
May 2022 |
51.20 |
60.20 |
|
June 2022 |
53.25 |
62.30 |
|
July 2022 |
48.15 |
57.35 |
Long-term trading plan for WTI Crude
Let’s finalize our technical analysis of US CRUDE.
The key levels are marked in the chart above. Short positions appear to be quite relevant as the projected oil price may drop to 35 USD within one or two years.
They can be opened at the current level at around 67 USD. Stop Loss should be placed above the latest high of 77 USD.
Profits can be fixed at two targets: a shorter-term target is at around 49 USD. More patient bears might be lucky to close at approximately 35 USD.
You can also close 50% of your position at the first target and then fix the rest at 35 USD. Observing your risk management rules is very important. Avoid losses exceeding 1% of your deposit!
Get access to a demo account on an easy-to-use Forex platform without registration
Our blog provides daily short-term oil forecasts and trading signals based on technical analyses and margin zones.
USCrude Technical analysis is presented by Mikhail Hypov.
Oil weekly price forecast as of 09.01.2023
Oil is trading in the medium-term downtrend. Last week, traders tried to break out the trend border 81.80 – 80.75 but failed. The price has been down and is now testing the support zone 74.53 – 73.83. If this zone is held up, the correction will continue, and last week’s high will be broken through. In this case, the trend could turn up.
If the price breaks out the support zone 74.53 – 73.83, it should break through the December low and test the next support zone 71.03 – 69.98.
USCrude trading ideas for the week:
-
Hold down sell trades entered in resistance (В) 81.80 – 80.75. TakeProfit: 70.44. StopLoss: at the breakeven.
-
Buy according to the pattern at support (А) 74.53 – 73.83. TakeProfit: 81.41. StopLoss: according to the pattern rules.
Technical analysis based on margin zones methodology is presented by an independent analyst, Alex Rodionov.
Oil Price Forecast 2025 – 2050*
The EIA predicted that, by 2025, Brent crude oil’s nominal price would rise to $79/b. By 2030, world demand may drive Brent prices to $98/b. By 2040, prices are projected to be $146/b, because the cheap oil sources will then have been exhausted, making it more costly to extract the black gold. By 2050, oil prices are projected to be $214/b, according to the EIA’s Annual Energy Outlook. The EIA assumes that petroleum demand will flatten when the focus is more on natural gas and renewable energy. It also predicts economic growth of around 2% annually, while assuming and energy consumption decrease by 0.4% a year.
Although it seems ludicrous now, some situations could put oil prices as high as $200 a barrel. The EIA forecast Brent oil prices of $214/b in 2050 if the cost to produce oil drops and crowds out competing energy sources.
In July 2008, oil prices reached a record high of around $133/b. Then they dropped to about $40/b in December before rising to $123/b in April 2011. The Organization for Economic Cooperation and Development (OECD) previously forecasted that Brent might go as high as $270/b. The OECD based its prediction on skyrocketing demand from China and other emerging markets.
*Important reminder: remember that long-term price forecasts for any investment asset are very approximate and may change due to various factors. Read on to find out which factors may affect the price of crude oil.
How Did the Price of Crude Oil Change Over Time?
Below is a chart showing the price for West Texas Intermediate (NYMEX) Crude Oil over the last 5 years. The shown prices are in U.S. dollars. On the chart, you can clearly see the monstrous drop that happened earlier this year, and how the price has been going up and stabilizing in the months thereafter.
Source: macrotrends.net
Factors That May Affect the Price of Crude Oil
We know that oil is an indispensable raw material in the world and that it is used both as raw material and fuel to make plastics, pharmaceuticals, and many other products. Hence, the demand for oil remains strong, and these industries’ health will determine most of the world’s oil demand. If demand from these industries increases while production stagnates, it will lead to higher prices for this commodity. Of course, and vice versa, if these industries are in a recession, their oil demand will be lower, so demand will decline. If production remains stable or increases in this case, it will logically lead to a drop in the price of a crude oil barrel.
As you will have understood, it is mainly by analyzing the difference between supply and demand that you will determine how the price or price of crude oil will evolve.
It should also be noted that this analysis is slightly more complex today than it used to be. Until a few years ago, it was pretty easy to understand how these prices would behave. At the time, the US was the largest consumer of crude oil. On the other hand, OPEC was the main supplier to the market in terms of production. But over time and the years, this situation has become more complex and slightly more confusing. One explanation for this phenomenon is that oil drilling technologies have improved greatly and resulted in better supply. Besides, we have seen the emergence of alternative solutions for this production. Finally, new players have also joined, including China, a major oil consumer in the world.
Below we have listed factors that change the supply or demand for oil and thus contribute to the evolution of this commodity’s price and price.
-
Production data in barrels per day from OPEC countries. Too much production generally leads to lower oil prices per barrel and vice versa. US crude oil inventories data is published weekly, which also affects WTI.
-
Supply, which is published weekly on the economic calendar. Big supply also contributes to falling prices, while little supply leads to higher prices.
-
The international geopolitical situation. Conflicts affecting the oil-producing and exporting countries often influence the development of the price per barrel.
-
The value of the US dollar on the currency market. As a barrel of oil is denominated in dollars, this currency will be weaker, and more oil purchases will be stimulated by holders of other currencies.
Conclusion: Is Oil a Good Investment?
When a product becomes scarcer, the price will rise because the demand will continue for a while. The earth will soon be exhausted, and there will be no more oil; therefore, oil is a good investment. It is not that investing in oil makes you rich in the short term, like the stock market and other assets can, but oil certainly has its positive aspects. If, in these uncertain times, you are now looking for investments that will certainly increase in value in the future and an asset that is easily accessible to individuals, then investing in petroleum is probably something for you.
Oil is an attractive investment, even if the market price fluctuates a lot, but the investment often becomes favorable in the long term. Oil is a limited commodity, and its price appears to have stabilized at some price point. The oil price is likely to increase significantly in the future due to the lack of solutions to these shortages in the near future. Until oil replacement is found, economies worldwide will remain dependent on oil.
|
Month |
Open |
Low-High |
Close |
Mo,% |
Total,% |
| 2020 | |||||
|
Dec |
47.29 |
46.82-54.94 |
54.13 |
14.5% |
14.5% |
| 2021 | |||||
|
Jan |
54.13 |
54.13-57.73 |
56.88 |
5.1% |
20.3% |
|
Feb |
56.88 |
56.88-61.32 |
60.41 |
6.2% |
27.7% |
|
Mar |
60.41 |
55.81-60.41 |
56.66 |
-6.2% |
19.8% |
|
Apr |
56.66 |
52.35-56.66 |
53.15 |
-6.2% |
12.4% |
|
May |
53.15 |
53.15-57.22 |
56.37 |
6.1% |
19.2% |
|
Jun |
56.37 |
56.37-58.81 |
57.94 |
2.8% |
22.5% |
|
Jul |
57.94 |
57.94-62.45 |
61.53 |
6.2% |
30.1% |
|
Aug |
61.53 |
61.53-66.32 |
65.34 |
6.2% |
38.2% |
|
Sep |
65.34 |
65.34-69.17 |
68.15 |
4.3% |
44.1% |
|
Oct |
68.15 |
62.96-68.15 |
63.92 |
-6.2% |
35.2% |
|
Nov |
63.92 |
59.06-63.92 |
59.96 |
-6.2% |
26.8% |
|
Dec |
59.96 |
55.40-59.96 |
56.24 |
-6.2% |
18.9% |
Make sure to create a free demo account on LiteFinance! LiteFinance is a useful platform for both novice and expert traders. You will be up to date on interesting updates about crude oil as an investment asset, and the user-friendly interface will come in handy if you decide to trade crude oil or any other commodity.If you look at the price changes of oil for a while now, you will start to see a pattern, and as an investor, you can respond smartly to this. In this way, the investor can significantly boost his investment amount with the profits from oil. If you want to invest in oil, it is a good investment to get in when the oil price is at a certain bottom. If you step in right now, investing in oil is a solid and profitable investment for the future. Of course, there is no guarantee that oil prices will ever rise as much as in the past, but a regular rise can mean a lot to the investor. Oil is a limited resource and is probably the most precious material in the world. Investing in this commodity is one way to improve your overall investment portfolio.
The content of this article reflects the author’s opinion and does not necessarily reflect the official position of LiteFinance. The material published on this page is provided for informational purposes only and should not be considered as the provision of investment advice for the purposes of Directive 2004/39/EC.