
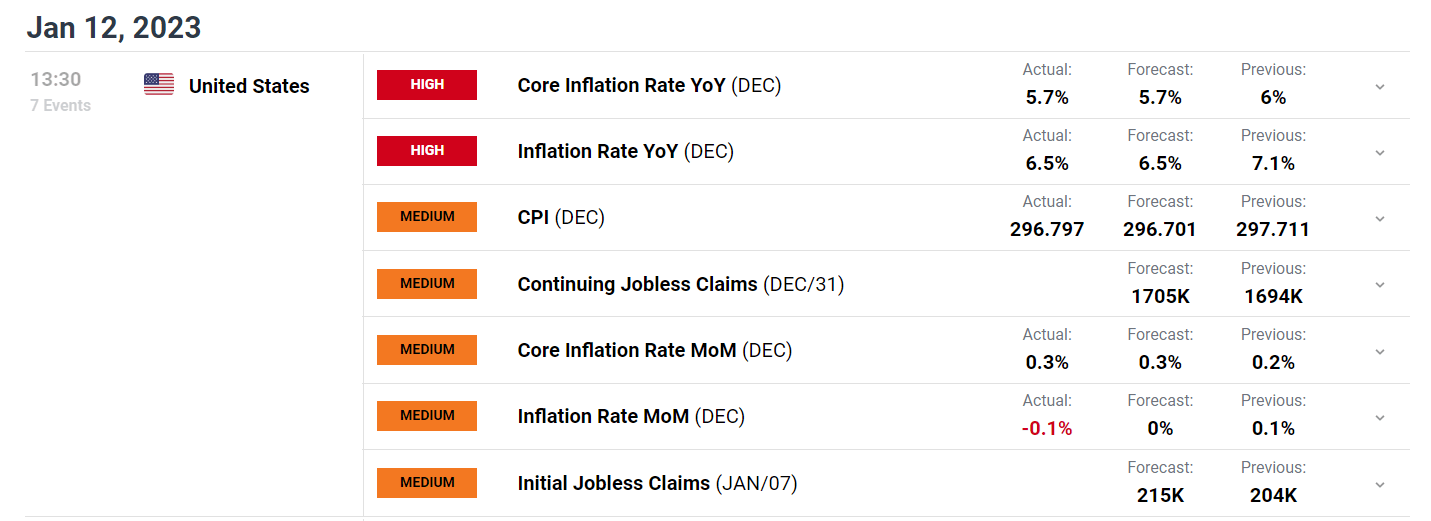
US Inflation Meets Expectations on Both Measures
- US headline CPI (Dec) 6.5% vs prior 7.1%
- US core CPI (Dec) 5.7% vs 6% prior
- Market expectations for a 25 bps hike next month surge from 77% to 95%. S&P shoots higher, USD dips.
Recommended by Richard Snow
Get Your Free Equities Forecast
Customize and filter live economic data via our DailyFX economic calendar
Food prices rose 0.3% in December while the energy index declined 4.5%, as energy and gas prices continue to drop at the pumps. The biggest contributor to the index, shelter, contributed 0.8% to the overall monthly change from November.
“The index for gasoline was by far the largest contributor to the monthly all items decrease, more than offsetting increases in shelter indexes“ – BLS
Market Response and a Case for a Fed Pause?
Positioning heading into the CPI report suggested markets expected another leg lower on the inflation front. S&P500 futures rose in anticipation while the benchmark for USD strength, the US dollar index, consolidated around the March 2020 high of 103 after a spate of heavy losses at the back of last year continuing into 2023.
For a long time now, stubbornly high US shelter data had resulted in a drag for prior inflation prints given its large weighting (32.77% of the reading) and lagging nature. More real time rent/housing data, however, points to these readings trending lower in months to come.
Towards the end of 2022, Jerome Powell highlighted US inflation ex-shelter as a better gauge of inflation.
With inflation coming down and financial conditions remaining tight, market expectations for next month’s interest rate setting meeting remain largely in favor of a 25 bps hike (77%). With core goods dropping and concerns on Wall Street about a likely recession, we may just see a change in tone form the Fed on February the 1st.
US Core CPI (Inflation Minus Volatile Food and Energy Prices)
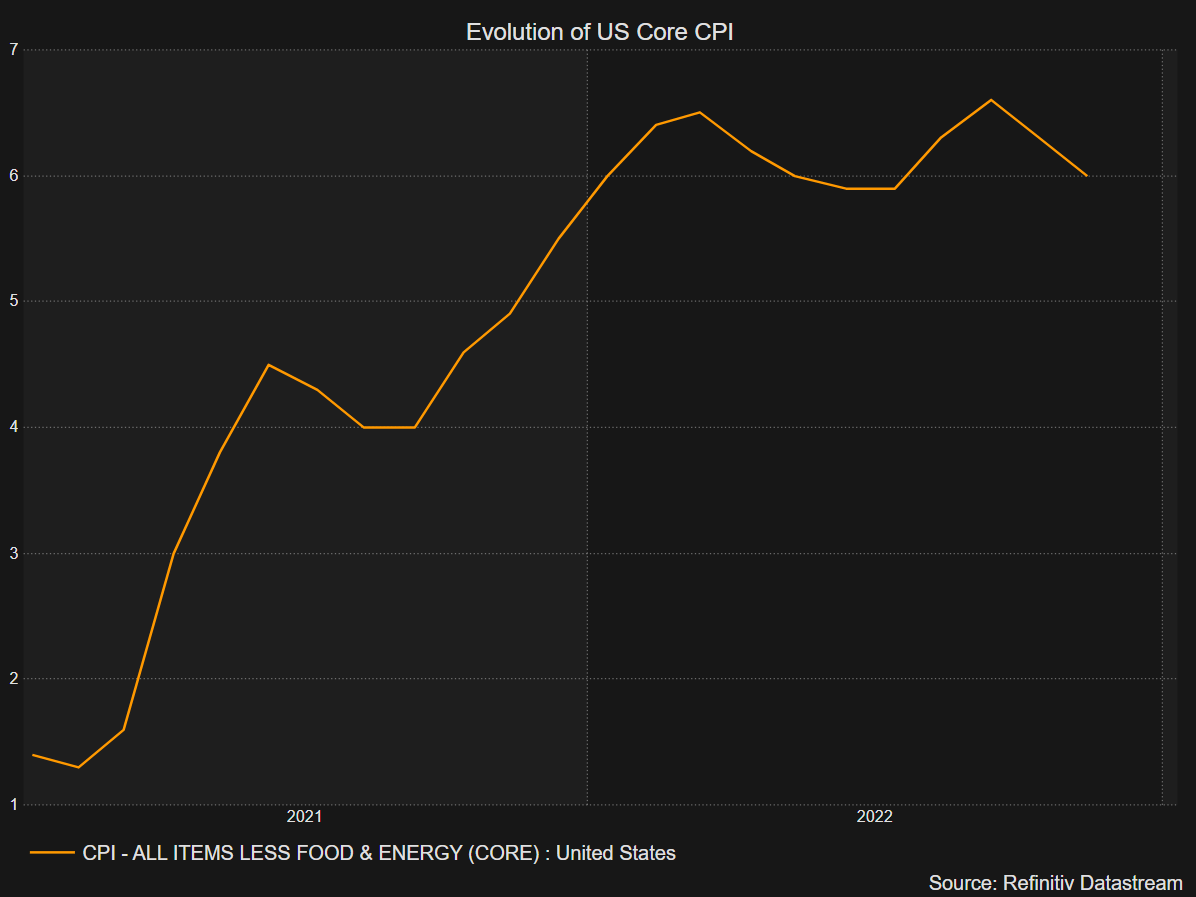
Source: Refinitiv Datastream, prepared by Richard Snow
Recommended by Richard Snow
Introduction to Forex News Trading
US Dollar Basket (DXY) 5 Mins Chart
The dollar witnessed an initial spike higher but proceeded to move lower in line with the recent trend of dollar selling. Higher market conviction about a Fed pause remains dollar negative in the absence of external shocks that prompt a dash for liquidity.
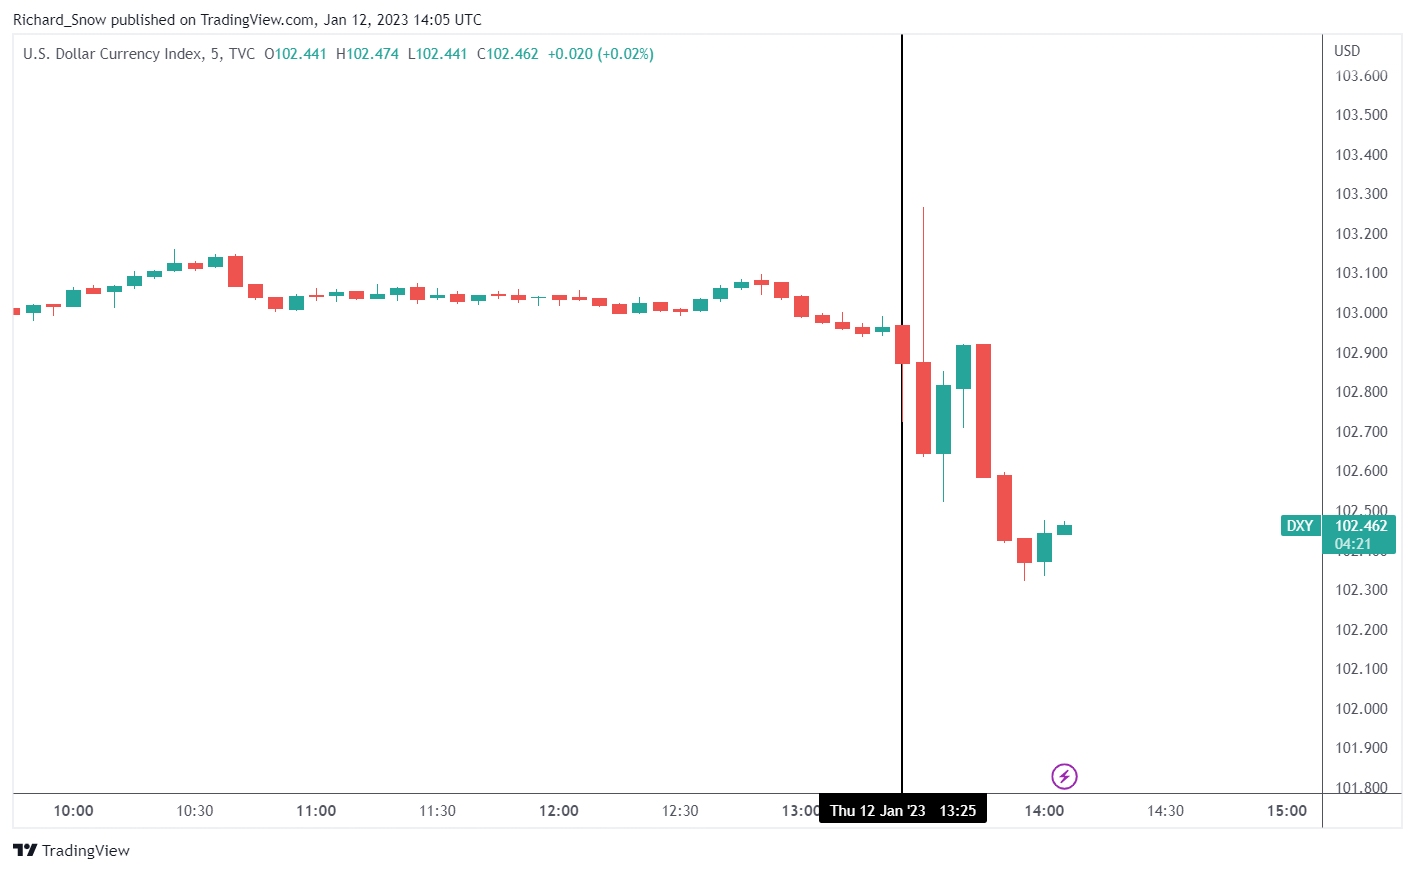
Source: Tradingview, prepared by Richard Snow
US 2 Year Yields Daily Chart
The 2 year treasury yield eased after the data. The 2 year yield most closely tracks the Fed’s medium term time frame and hence, tends to react to sudden changes in interest rate expectations. The 10 year yield trades lower too.
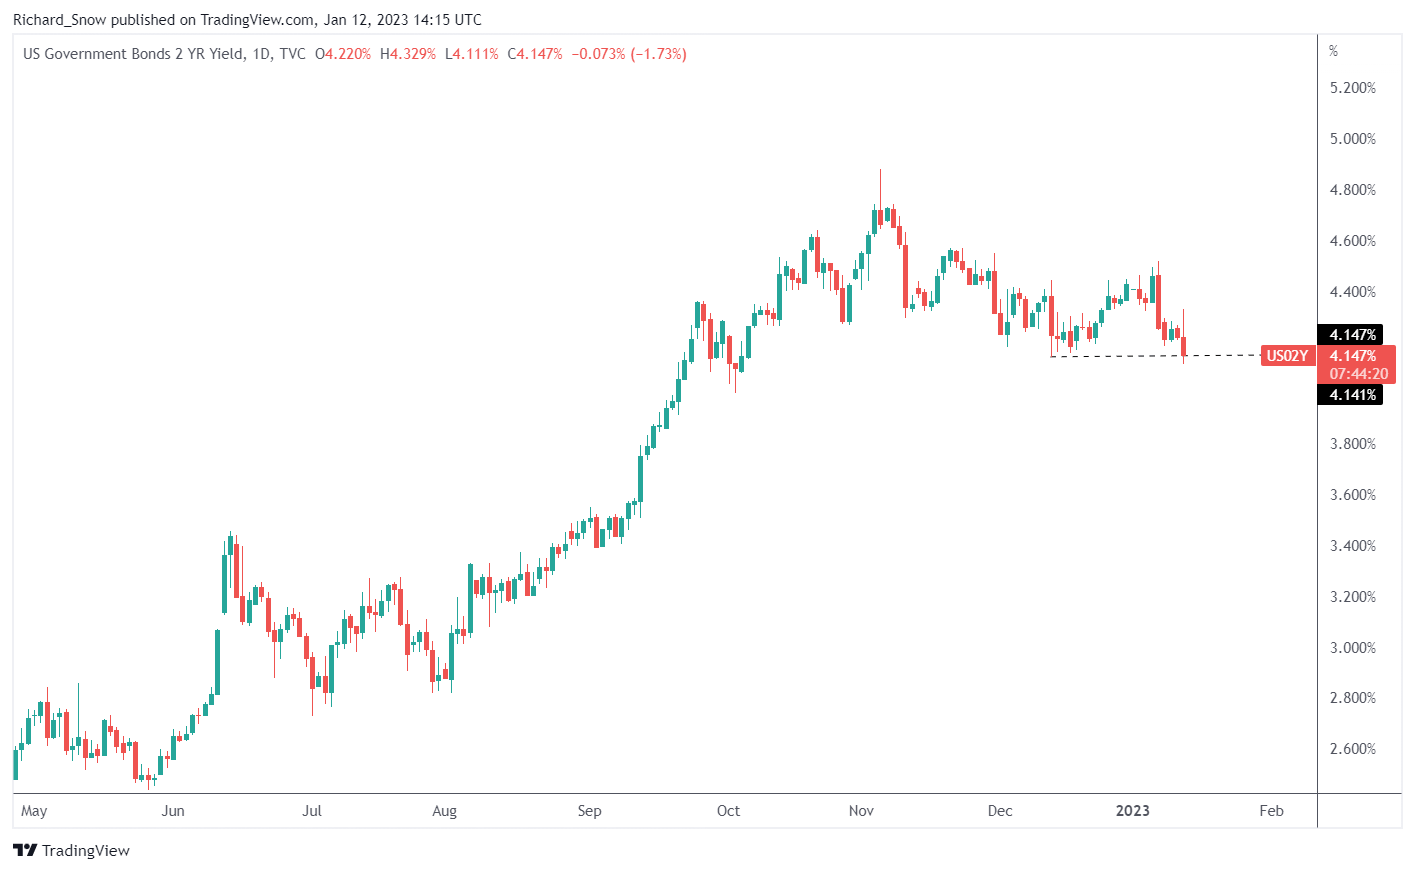
Source: Tradingview, prepared by Richard Snow
S&P500 Futures (ES1!) Daily Chart
Us equities are poised for another test of the major trendline resistance after surging past the psychologically important 4000 mark. The outlook on the index is troublesome though as recession concerns and lower expected corporate earnings are expected to roll in starting tomorrow with large US banks.
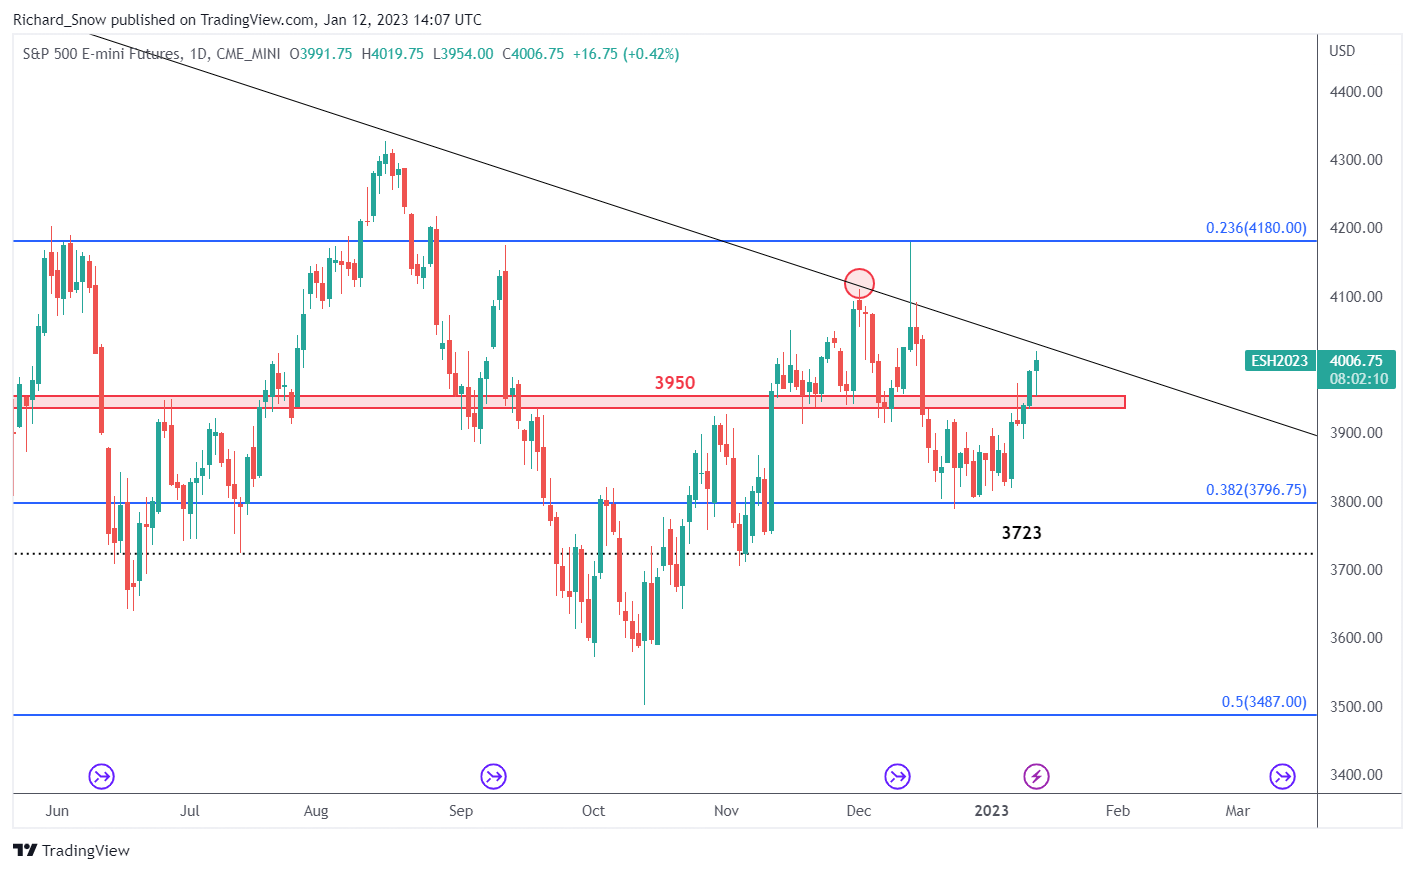
Source: Tradingview, prepared by Richard Snow
— Written by Richard Snow for DailyFX.com
Contact and follow Richard on Twitter: @RichardSnowFX