
Bitcoin (BTC) Price Analysis:
- Bitcoin prices hold steady after 26% rally drives prices towards levels last tested before the collapse of FTX.
- BTC/USD gains after bulls break $20,000.
- Cryptocurrency market capitalization eagerly approaches $1 Trillion mark.
Recommended by Tammy Da Costa
Get Your Free Bitcoin Forecast
Bitcoin (BTC/USD) Forecast:
Bitcoin prices (BTC) have made an incredible recovery over the past seven days, driving the major cryptocurrency above $20,000. Despite growing concerns of a global recession, BTC/USD has risen over 26% this month, pushing prices to another barrier of resistance at the November high of $21,473.
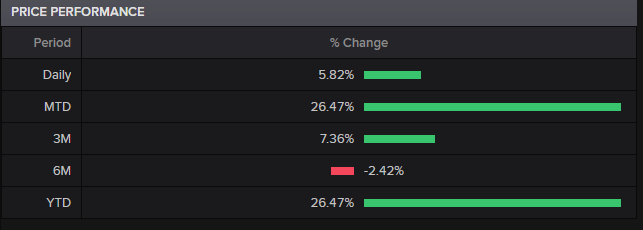
Source: Refinitiv
With the recent move and a break of the December 2017 high of $19,666 providing a glimmer of hope for bulls, the total crypto market cap is nearing $1 Trillion.
Following the collapse of FTX in early November, an increase in bearish momentum fueled the decline that drove Bitcoin to low of $15,479 (2022 low) that same month.
Although shifts in sentiment and rising interest rates continue to threaten risk assets, technical levels have provided an additional catalyst for price action.
Bitcoin (BTC/USD) Technical Analysis
On the daily chart below, BTC/USD is trading above the 200-day MA (moving average) for the first time in over a year at $19,525. With the $19,666 support forming at the 2017 high, a move below $18,000 and a resumption of bearish momentum could drive price action back towards longer-term support at $17,792.
Introduction to Technical Analysis
Learn Technical Analysis
Recommended by Tammy Da Costa
Bitcoin (BTC/USD) Daily Chart
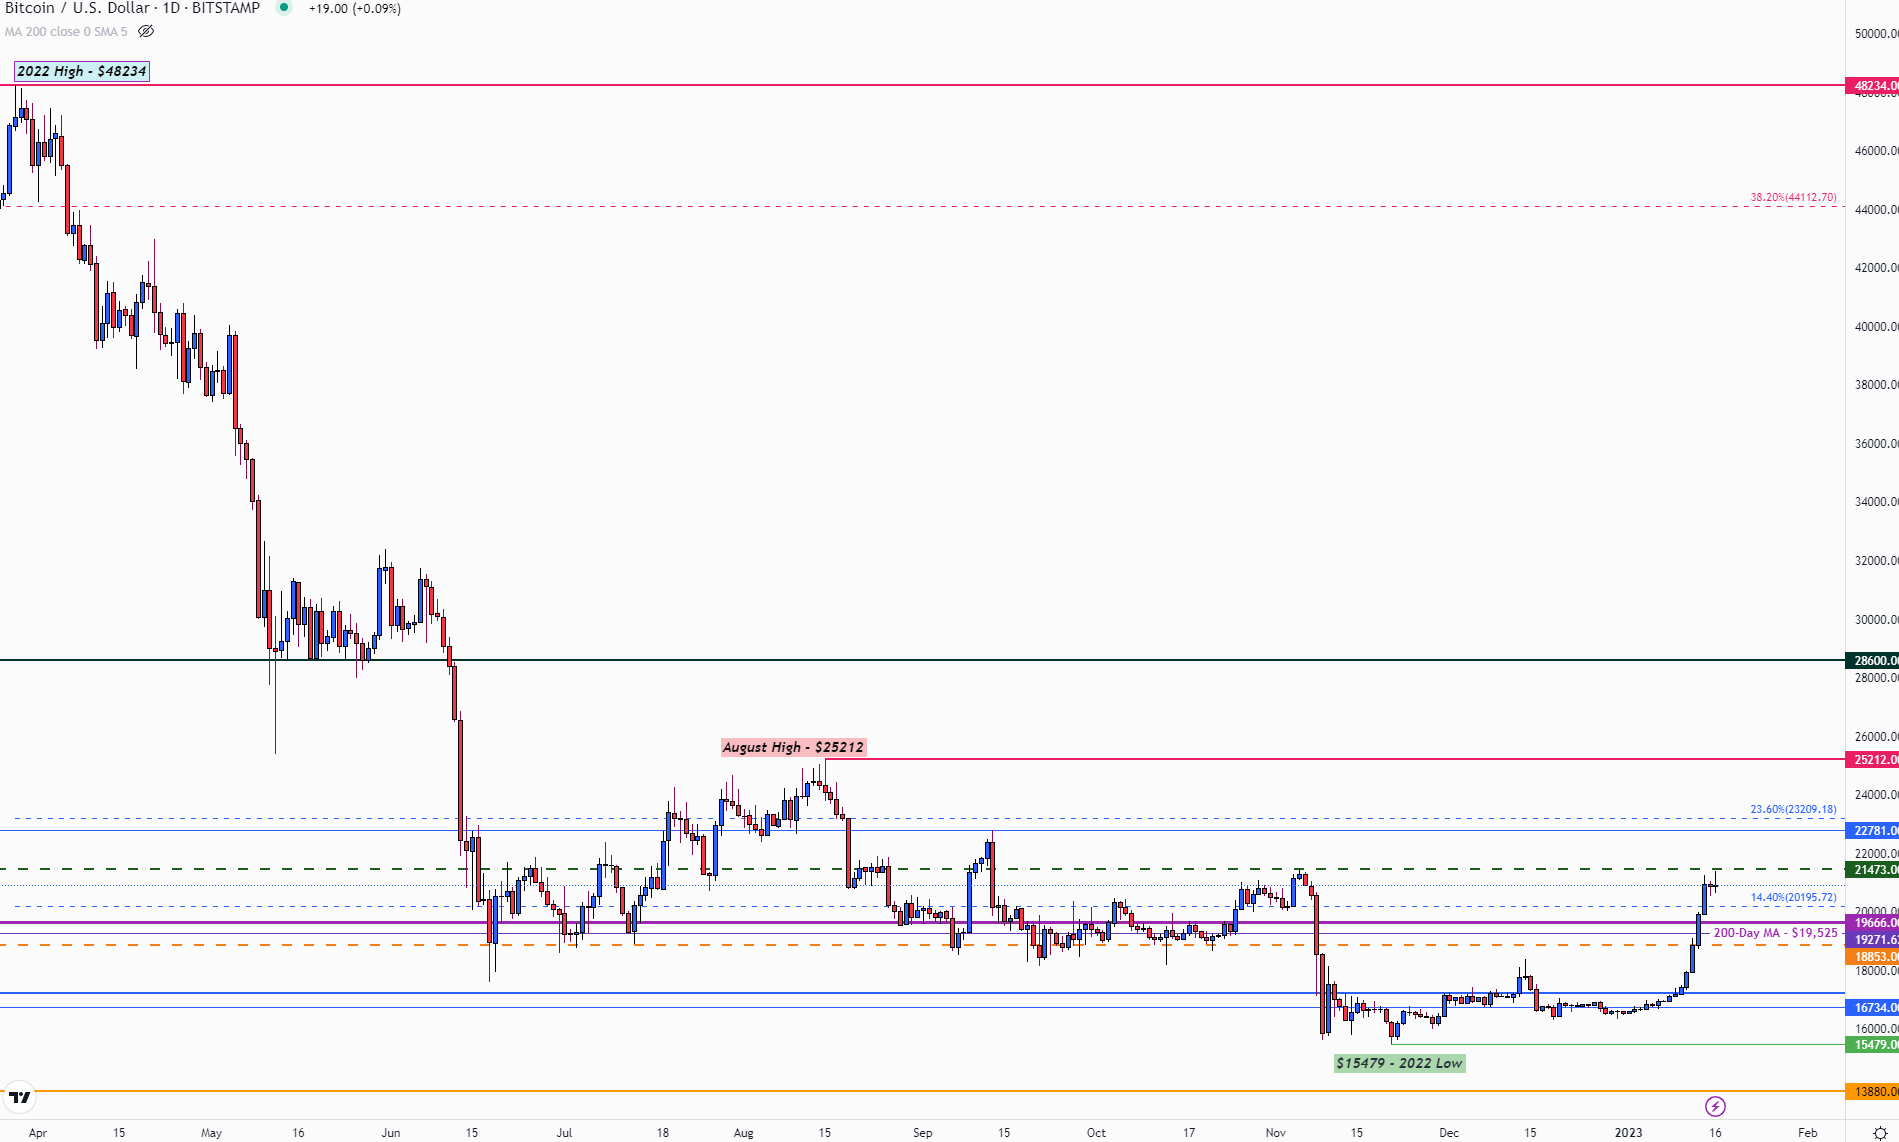
Chart prepared by Tammy Da Costa using TradingView
After rebounding off the 2022 low, a narrow range began to form between $16,000 and $18,000. With psychological support and resistance resulting in a zone of confluency, the 2018 high helped limit the upside around $17,235.
Bitcoin (BTC/USD) Weekly Chart
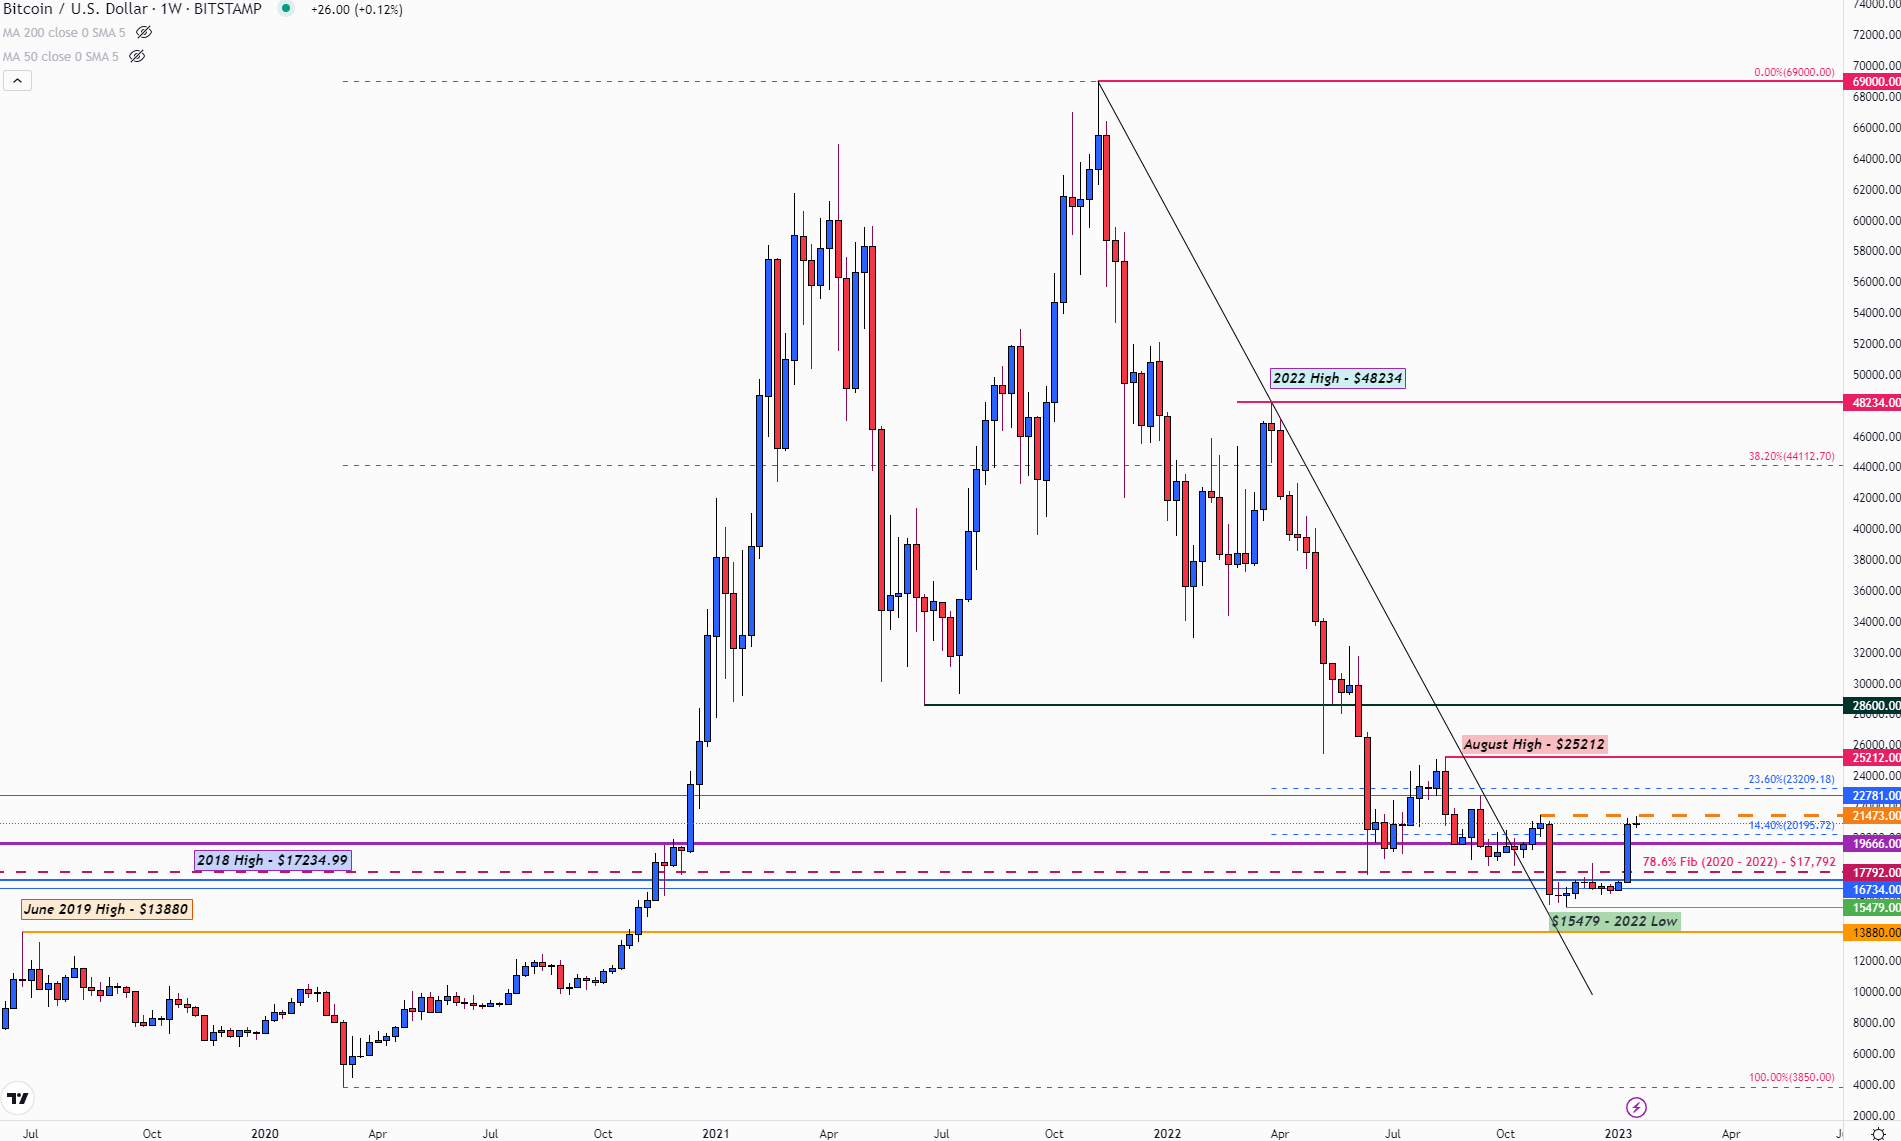
Chart prepared by Tammy Da Costa using TradingView
Just above, the 78.6% Fibonacci retracement of the 2020 – 2022 held steady at $17,792. While a hold above the 14.4% Fibonacci retracement of the 2022 move at $20,195 has helped fuel bullish momentum, the November high has come back into play at $21,473. If prices gain traction above this level, the next level of short-term resistance could form at $22,781 (September high) towards the August 2022 high of $25,212.
Trade Smarter – Sign up for the DailyFX Newsletter
Receive timely and compelling market commentary from the DailyFX team
Subscribe to Newsletter
— Written by Tammy Da Costa, Analyst for DailyFX.com
Contact and follow Tammy on Twitter: @Tams707