
BP Earnings, FTSE 100 Index Analysis
- BP announces record profit, share buybacks and a step back from oil output reductions
- FTSE 100 Index approaches its first test of the newly formed all-time high on upbeat BP results. BP share price and positive tailwinds from Shell help keep the index moving higher
- The analysis in this article makes use of chart patterns and key support and resistance levels. For more information visit our comprehensive education library
Recommended by Richard Snow
Get Your Free Equities Forecast
BP Announces Record Profit, Share Buybacks and a Slower Reduction in Oil Output
The London based company produced record profits of $27.7 billion in 2022, eclipsing its previous record of $26.2 billion in 2008, as oil prices soared. BP was well positioned to supply a constrained market with gas as economic sanctions on Russian energy commodities were implemented in defiance of Russia’s aggression towards Ukraine.
Likewise, Shell – the largest company in the FTSE 100 index – benefitted from increases in energy prices, particularly gas, which saw it post a record profit of $42 billion last year. BP has also announced a further $2.75 billion in share buybacks and plans to post a dividend of 6.61 cents. The stellar performance brings the combined profits of Western oil companies, including Chevron, Shell and Exxon Mobil to more than $159 billion for 2022.
In a rather controversial admission, BP announced it will be scaling back on its plans to reduce oil and gas production by 2030. The previous target was a 40% reduction from 2019 levels, which has now been reduced to 25%. Earlier this year the UK government announced a special windfall tax to partially fund a government subsidy that helps citizens pay for the more expensive energy bills, especially in the colder winter months. The amount of future taxation on oil companies needs to be well thought out because of the potential threat of such large companies moving to jurisdictions that have less aggressive taxation regimes.
The BP share price now appears to be attempting a bullish breakout as the recent surge in price action hovers around the prior highs that capped gains during this period of relative consolidation. The RSI suggests there could be more upside potential as the indicator is yet to suggest we are in overbought territory.
BP Share Price (Daily Chart) Showing Uptick Post Earnings Release
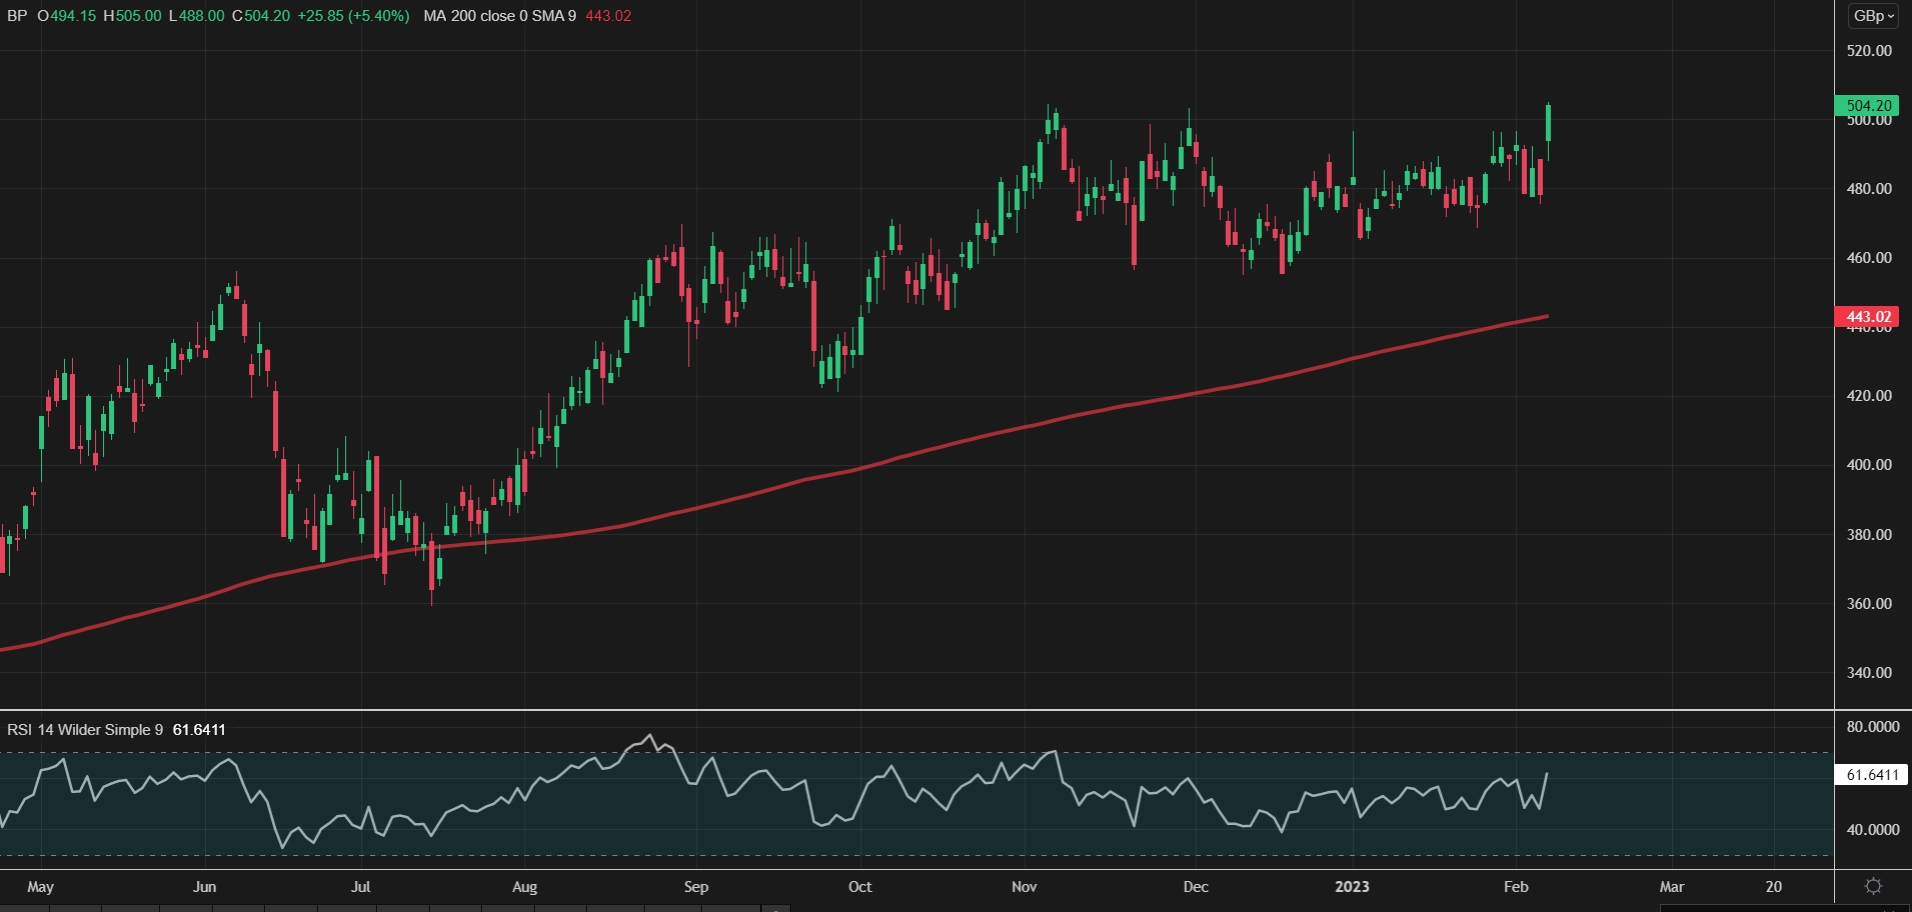
Source: TradingView, prepared by Richard Snow
FTSE 100 Index Approaches Fresh All-Time High on Stellar Oil Profits
It is no surprise that the FTSE 100 index remains elevated but could we see this trend begin to slow down as energy prices retreat from extreme levels? The answer to this question depends on the pricing mechanisms and year-forward pricing of gas, but also the relative performance of big banks and miners. The big mining companies have enjoyed a commodity boon of late as a result of China’s reopening.
After pulling back from marking a new all-time high, finding support around the 7680 level of prior resistance, the UK index now appears set for another go at the all-time high. Later this week we have our first look at UK GDP for Q4 and the year as a whole as UK citizens wait patiently to find out if a technical recession has been avoided. Early estimates of a flat month on month performance in December suggests it will be enough to avoid a second successive quarter of negative GDP growth – the definition of a technical recession. Should there be a negative impact to the data surfacing in the pound sterling, this may provide a further tail wind for the equity index to break to a new high.
FTSE 100 Index Daily Chart
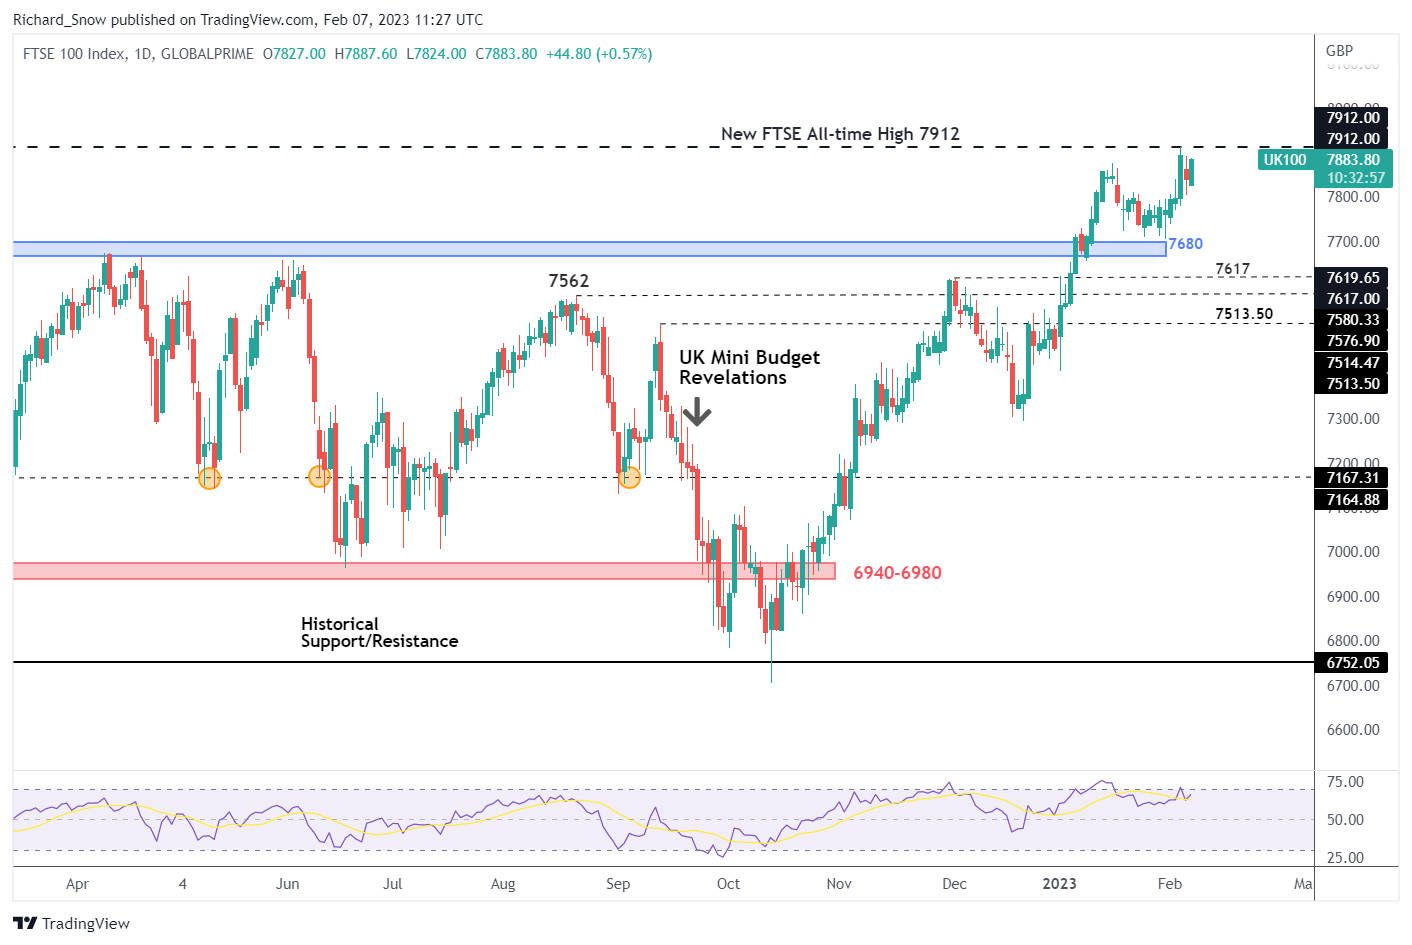
Source: TradingView, prepared by Richard Snow
— Written by Richard Snow for DailyFX.com
Contact and follow Richard on Twitter: @RichardSnowFX