
Every trader has many times come across the bear flag pattern, which resembles a pennant. The formation got its name due to the fact that after a consistent price decline, a slight upward correction occurs, resembling a flag. This gives a false price reversal signal. However, this is a common misconception in trading, as the price continues to move in the direction of the original trend after a pullback. As a rule, a flag emerges on high trade volumes.
A strong price decline draws the flagpole. The flagpole is the basis for the target identification after the flag breakout downside.
So, what does a bearish pattern mean? How to trade a bearish flag and make profits? Read on, and you will know!
The article covers the following subjects:
What Is a Flag?
The flag is a technical analysis pattern that signals the trend continuation; it could be either bullish or bearish. This is a volume pattern, that is, its appearance on the chart is accompanied by high volatility and an increase in trading volumes.
The flag pattern can be found in any market, Forex, cryptocurrency, stocks, commodities, and off-exchange markets.
The pattern is built based on a strong price movement for several high-volume bars, called the flagpole. Then there is a short-term consolidation counter trend (a flag is formed), and then the price continues to move along the trend to the distance of the flagpole.
The bullish flag warns traders about the uptrend continuation and gives a signal to enter a long trade. The bear flag, on the contrary, indicates the continuation of the downtrend. When analyzing the price chart, there are other price action patterns that work great in combination with the flag pattern.
You can learn more about such patterns in the article Most efficient Forex patterns: a complete guide.
What is a Bear Flag Pattern?
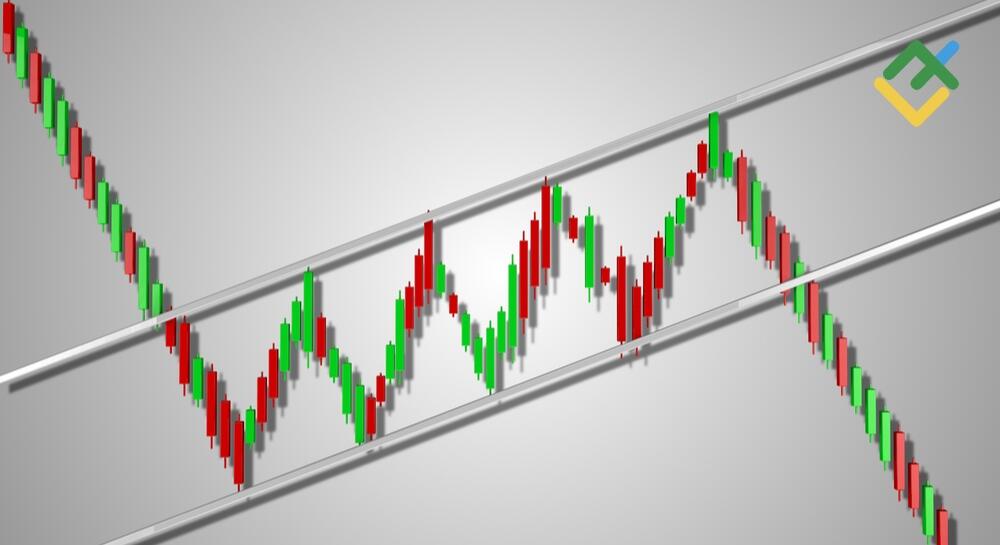
A bearish flag is a technical analysis pattern that signals the continuation of a downtrend. First, the price falls sharply in the chart for several candlesticks, the flagpole is formed. Next, the decline stops, forming a low point. The price reverses, that is, the bulls try to prevent the market from falling. Following this futile attempt, the high of the bearish flag is formed, and the price moves down again to the distance of the flagpole, where the pattern completes.
As a rule, a bear flag is formed along with high trading volumes.
What Does a Bear Flag Pattern Look Like?
The bear flag pattern is quite common. If the price consistently declines in the chart, this could be a potential bear flag. The pattern is confirmed by strong volume.
After the decline, a short-term upward consolidation begins, which is called the flag. It is important to emphasize that the flag pattern is canceled if the consolidation is rather long. In this case, it is necessary to look for bearish reversal patterns, such as hanging man, shooting star, bearish engulfing, and others.
Next, the market breaks out the flag downside; the price movement is quite strong, which is indicated by a volume candlestick in the bear flag chart. After the flag consolidates below the flag line, you enter a short trade. Next, the price movement can accelerate or slow down. A sharp drop usually occurs amid negative news or weak economic data.
The flagpole could be of two shapes:
-
Sharp drop;
-
Gradual decline.
How Do Bear Flag Patterns Work?
The bear flag is a trend continuation pattern based on which traders decide to enter or exit trades. Short positions are opened when a bear flag is detected. If the flagpole forms downwards, the bears are testing the support level. In case of a successful breakout, a short-term upward correction occurs, that is, a flag chart is drawn.
The support breakout gives bears more confidence. The downtrend continues, and more sell positions are opened, which increases the selling pressure.
Bear Flag vs. Bull Flag
The difference between bullish and bearish flags lies in the direction of movement. A bullish flag appears during an uptrend and signals a further rise in price. A bear flag indicates the downtrend continuation.
Both have the same structure: support and resistance levels, the flagpole, the flag, and the price breakout point.
How to Identify the Bear Flag Pattern
It is not difficult to identify a bearish flag in the chart if you know what it looks like and how it forms:
-
It is important to identify a clear bearish trend, as a bearish flag is a continuation pattern for a downtrend.
-
It is necessary to identify the flagpole of the pattern; it appears when the price declines sharply or gradually.
-
After the price has fallen to the support and broken it, the trend move slows down and changes its direction back up – this is a short-term upward consolidation. In fact, there is a test of the broken-out support level, then the price, as a rule, reverses again and goes down more intensively.
-
After the downtrend resumes, you need to determine the entry point for a short trade and set a stop-loss order.
-
The target is determined by the level of the flagpole. With the help of technical analysis tools, it is necessary to project the trajectory of price movement.
Will Volumes Help?
Analysis of trade volumes when a bear flag pattern appears is one of the key factors in making trading decisions.
The volume indicator shows the current trend in the market. If volumes rise during the formation of a bearish flagpole, this means that the sellers are strong enough and can send the price even lower. During the period of upward consolidation, volumes, as a rule, decrease – the bulls do not have enough strength to reverse the price. Bearish pressure then increases, and the price goes down, which means the bearish flag has worked out.
The Bear Flag and 50-Period Moving Average
To correctly identify the bearish flag pattern, you need to add the simple moving average, SMA 50, to the chart.
As you see from the daily EURUSD price chart below, the price breaks out the moving average downside. The market continues declining and breaks it out. The price movement below the SMA 50 means the trend is bearish, and sellers prevail in the market.
It can be seen that after testing the broken-out support level, the bulls failed to cross the 50-period SMA line upwards. In addition, volumes decrease during the period of asset consolidation. Consequently, the market is completely under the control of the bears, and the EUR USD trading pair should continue falling. In this case, it is necessary to wait for the price to break out the flag and open a short position.
How to Use a Bear Flag in Trading
After careful analysis and determination of the bear flag chart pattern in the chart, it is necessary to use a well-established trading strategy. Below we will consider the most popular and convenient trading systems for the bear flag pattern trade.
Strategy №1: Bear flag breakout downside
This trading strategy is the most common among traders. The main idea is to wait for the breakout downside after the formation of the flagpole and flag and open a position to sell.
A step-by-step plan to trade the flag breakout level strategy:
-
Detect the flagpole of the bearish flag in the chart;
-
Expect the flag consolidation upward, that is, the formation of the bearish flag;
-
Expect the price to break out the flag down and make sure there is a strong bear trend using volume indicators, SMA 50, the RSI indicator, or candlestick patterns. You can find more information about how to read the candlestick chart in the article How to Read Candlestick Charts?;
-
When the pattern is confirmed, enter a short trade;
-
A stop-loss is set above the upper border of the flag;
-
A take profit is set at the distance in pips equal to the flagpole.
Strategy №2: The Bear Flag Pattern and Fibonacci Retracements
The trading strategy based on the Fibonacci levels suggests entering short positions on the price corrections.
How to trade a bear flag pattern using Fibonacci retracements:
-
Define a bearish trend in the forex chart, support and resistance levels;
-
Stretch the Fibonacci retracement grid from the upper level of resistance to the lower level of the previous support;
-
Define the flagpole of the bearish flag and expect a correction from the Fibonacci retracement level;
-
Expect the price to rebound from the upper trendline and enter a sell trade;
-
Set a stop loss a little higher than the correction pivot point;
-
A take profit is set at the distance equal to the flagpole length. In a more conservative strategy, set a grid for the targets and divide the profit target into several parts.
Strategy №3: The Bear Flag and Support Breakout
This strategy suggests entering short positions after the price breaks out the support level.
The bear flag trading strategy based on the support breakout:
-
Define a bear trend in the chart, as well as support and resistance levels;
-
Expect the support level test by the bears and look for an entry point;
-
Add the SMA 50 moving average to the chart to make sure that the trend is bearish and the selling pressure is strong. Use moving averages with periods 50, 100, and 200 in longer timeframes; in shorter timeframes, use the MAs with periods 9, 12, and 20. You can also use other technical tools;
-
Enter a short trade below the support level;
-
A stop loss order should be set above the flag top line;
-
The target is set at the distance equal to the flagpole length.
What Are The Pros And Cons Of The Bear Flag Pattern
Like any other technical analysis pattern, the bear flag formation has its pros and cons.
Benefits
-
The pattern is versatile. It can be used in different markets, including crypto currency, Forex, stocks, futures, and commodities. You can also employ the bearish flag pattern in different timeframes. The pattern works best in intraday trading. You can read more about price action patterns to employ in day trading in the article Day Trading Patterns for Beginners.
-
There are clear rules to enter and exit trades, as well as set stop losses. When entering a trade, one always knows where is the entry and exit points, so the risks are lower.
-
A 100% downward movement. If the bearish flag pattern is defined correctly, you can be sure the price will be falling.
-
A favourable risk/reward ratio.
-
The pattern occurs quite often.
Risks of using the pattern
-
An incorrect definition of the pattern can lead to a trap, and the trader will lose money. Flag correction in a standard formation should be no more than 30%. If the correction is more than 50%, then this is already a full-fledged reversal, not a correction.
- It will be difficult for beginner traders to identify this pattern in the chart. It is important to consider many factors, including confirming signals from other technical indicators and candlestick patterns, as well as volume confirmation.
Tips For Using a Bear Flag Pattern
The pattern may look simple, but you should be attentive when trading it. Here are some recommendations for you:
-
Before trading, it is important to wait until the flag completes and the price breaks it out. Until this moment, the pattern is not a confirmation of the downtrend continuation; a breakout of the trend line upward is possible.
-
It is important to confirm the figure by increasing trading volumes or other technical indicators, for example, RSI, SMA 50. You can also use candlestick reversal patterns and trend continuation patterns, for instance, hanging man, evening star, shooting star, two crows, and so on.
-
The price may not always drop to the height of the flagpole. Therefore, first, determine the nearest support level on the chart, so you can determine where to place a take profit.
-
Be sure to follow the rules of risk management and place stop orders. So you avoid unnecessary losses.
Conclusion
Summing up, it should be emphasized that the bear flag pattern is an important trend continuation pattern that occurs quite often in many financial markets. At the same time, this formation is considered one of the most reliable in technical analysis. However, the pattern needs to be confirmed by other technical tools, which requires some experience. Any trader can practice their skills absolutely risk-free on a demo account of the LiteFinance online platform.
The content of this article reflects the author’s opinion and does not necessarily reflect the official position of LiteFinance. The material published on this page is provided for informational purposes only and should not be considered as the provision of investment advice for the purposes of Directive 2004/39/EC.