
- AUD/USD supported on domestic recent data.
- Bulls eye a break of the inverse head and shoulders.
AUD/USD is trading at 0.6970 and in a tight 10-pip range between 0.6967 and 0.6977 on the day so far. The price has been capped below the recent 0.6990s recent highs in what has been a choppy consolidation range since the US Consumer Price Index event that showed ongoing disinflation.
AUD/USD has benefitted from a number of fundamentals in the past week or so, from domestic data, the China reopening story and the dovish sentiment building around the Federal Reserve narrative. Until this shifts more hawkish, risk assets, such as the Aussie, would be expected to continue to build on recent gains.
Domestic economic data are also showing resilience. November Retail Sales recorded a far stronger-than-expected rise of 1.4% month on month, which followed an upwardly revised October number. The monthly November Consumer Price Index also ticked higher to 7.3% YoY, with the core data also edging up. These data have strengthened expectations of another 25 bps rate hike from the RBA next month and pushed back talk that the central bank could be on the cusp of a policy pause, fuelling a bid in the Aussie.
”While the Australian economy is expected to slow overall this year, recessionary risks appear low. This should increase the resilience of the AUD and provide insulation against headwinds implied by forecasts of a slowdown in global growth,” analysts at Rabobank explained. ”Weaker global growth is traditionally a bearish factor for the AUD given its links with commodity prices.”We view the AUD as less likely to be swayed by speculative flows given that Australia no longer had a current account deficit and given that the narrowing of interest rates spreads between Australian and US interest rates,” the analysts added.
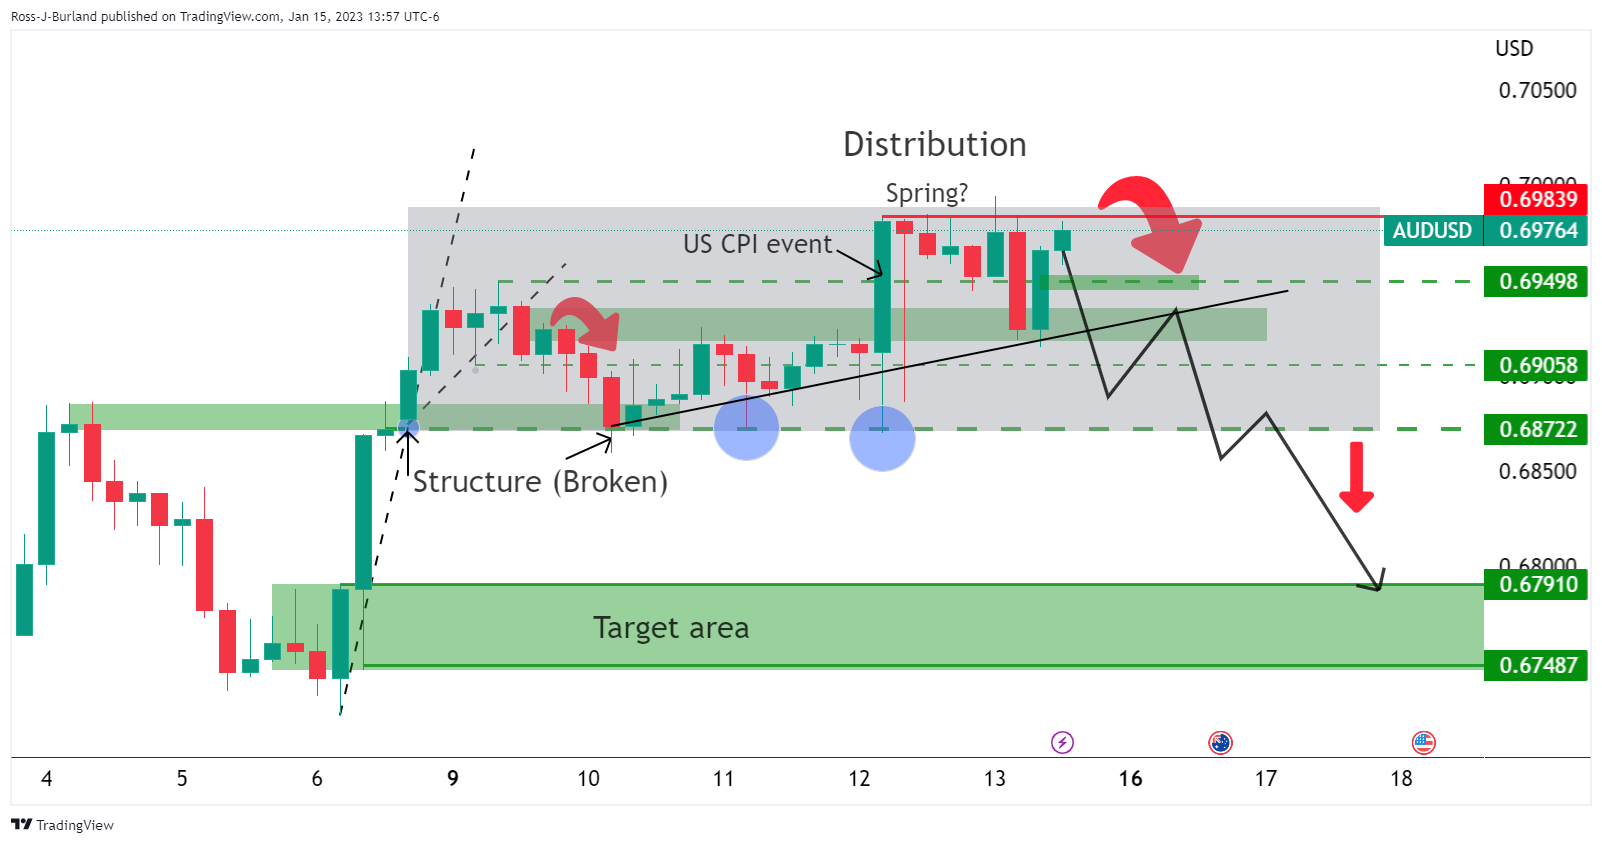
AUD/USD technical analysis
A bearish schematic could be drawn as follows on the four hour chart:
On the upside, an inverse head and shoulders could be forming:
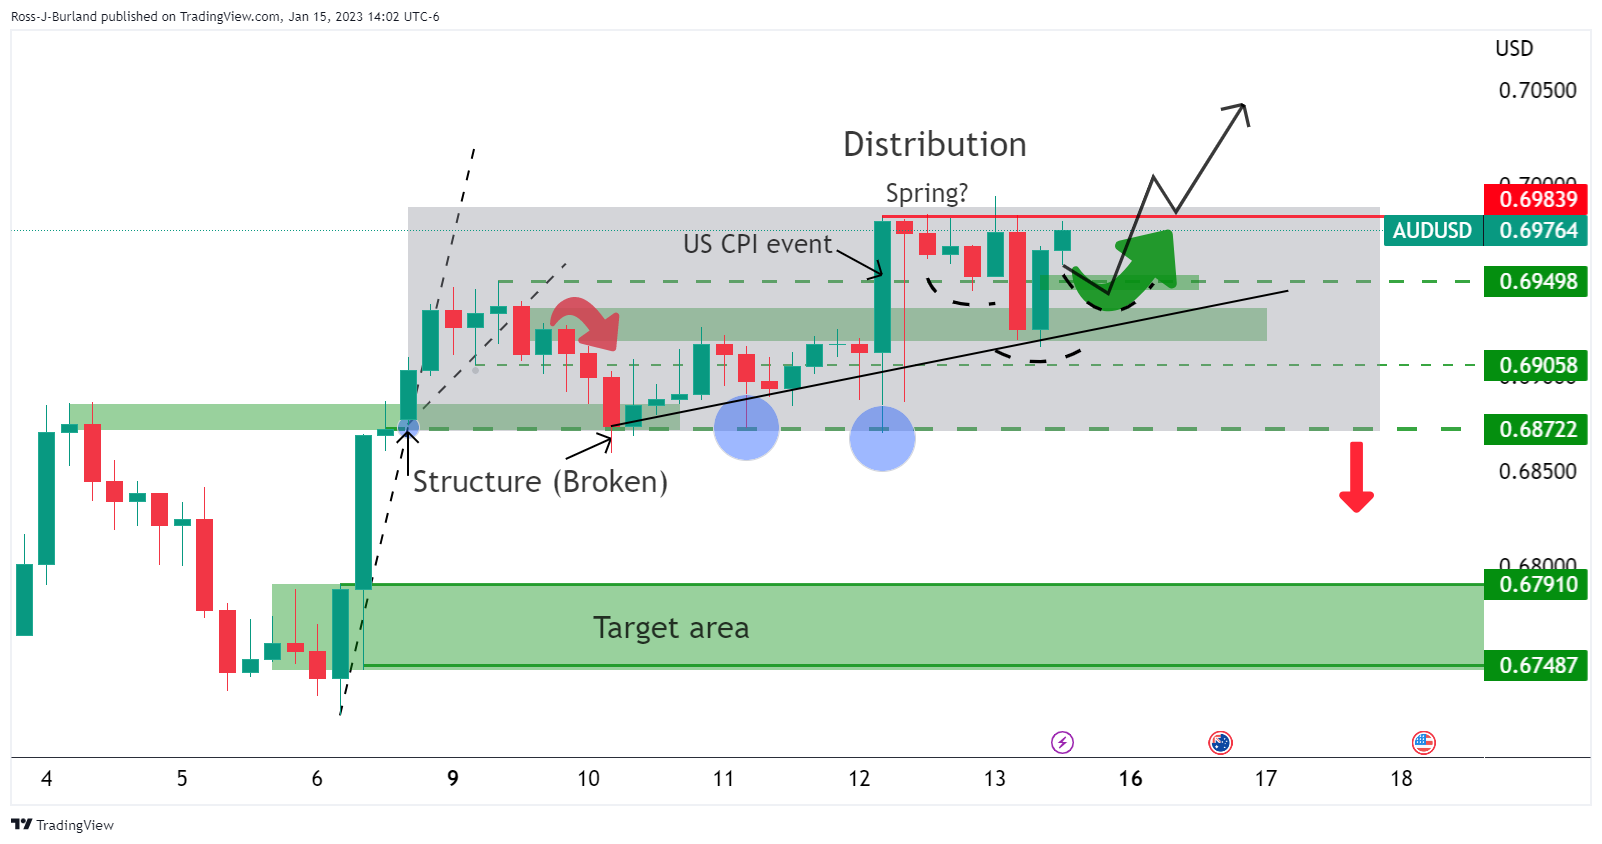
A break through the 0.6890s opens risk to 0.7050 and 0.7090 for sessions ahead, in line with the bullish trend.
AUD/USD H1 chart
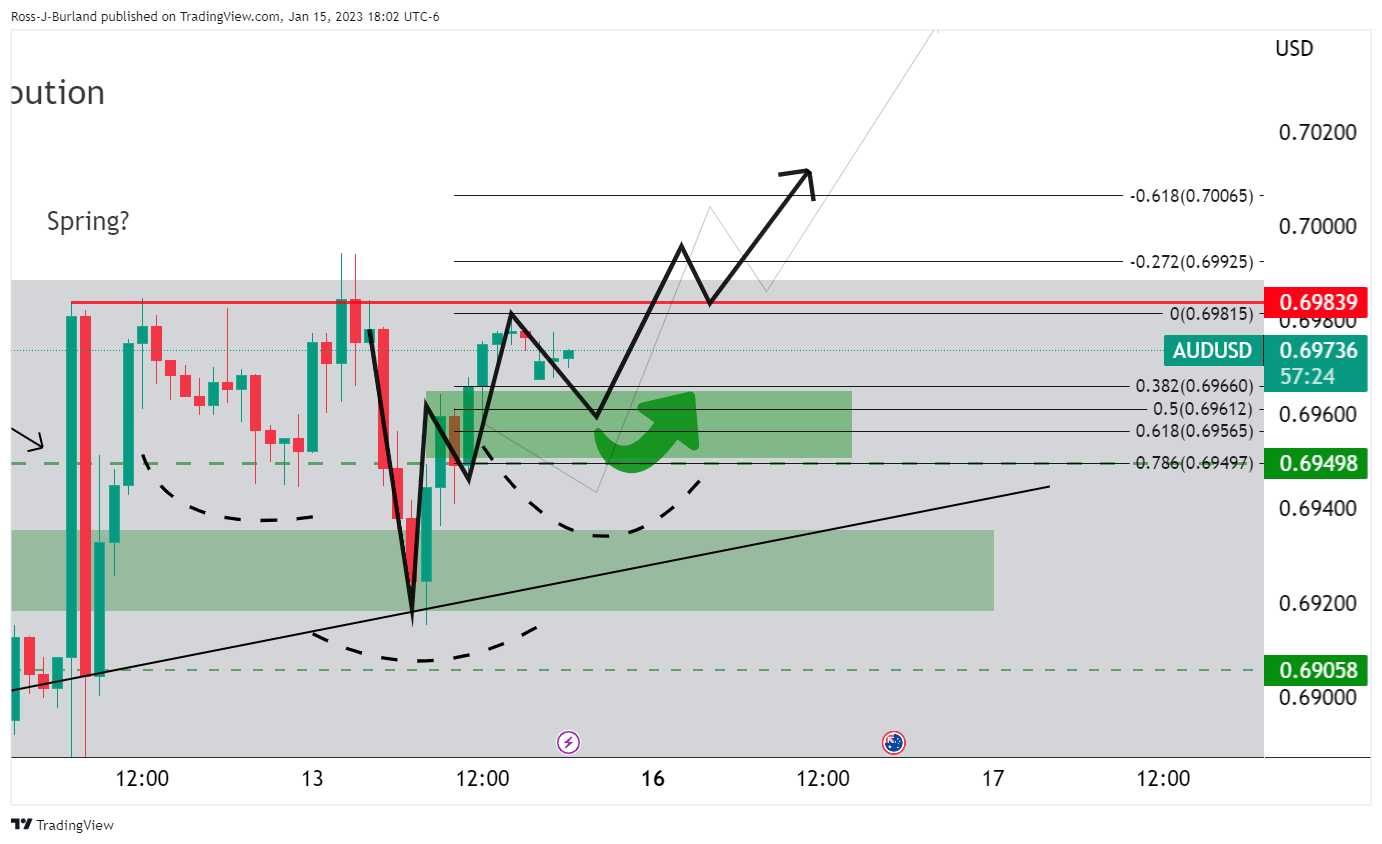
The hourly W-formation could see the price drawn into the 50% mean reversion support area prior to the next significant bullish impulse and breakout of the inverse head and shoulders neckline.