
The ascending triangle chart pattern came to us from Western technical analysis.
The formation of an ascending triangle pattern on the chart warns traders of an imminent upward impulse breakout.
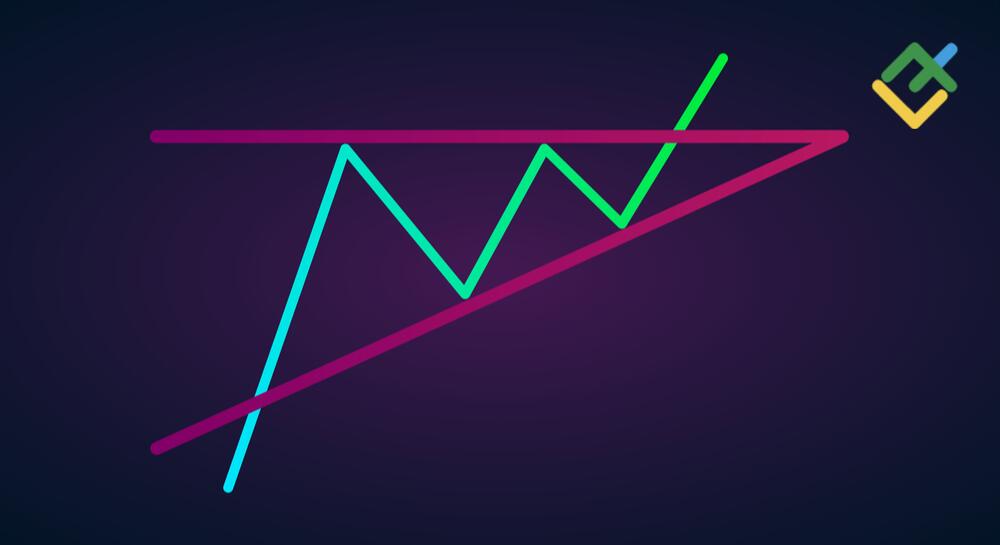
The pattern is characterized by “squeezing” the price from below. That is, the highs remain at the same level while the lows increase, “pressing” the price to the upper border. After that, there is an upward impulse breakout and the destruction of the counter resistance. Momentum gives confidence to market participants and signals a continuation of an uptrend line or a bearish trend reversal.
The ascending triangle pattern has a well-functioning trading system with specific market entry/exit points, as well as determining the stop loss level. Below, I will deal in detail with how to trade ascending triangle.
The article covers the following subjects:
What Is an Ascending Triangle Chart Pattern?
The ascending triangle pattern is a price growth pattern, which is constructed in the form of a rising triangle. That is, quotes are moving in an accumulative upward channel, in which the resistance line remains unchanged, and the support level is gradually growing, increasing the lows of the asset price.
In trading, this model can be found relatively often in any financial market, including the cryptocurrency market, Forex, the stock, and commodity markets. In addition, this chart pattern is one of the most commonly used patterns and can be employed in day trading.
What Does the Ascending Triangle Pattern Tell You
An ascending triangle in the chart signals an increase in the asset price by a given range. A rising triangle is more likely to work out in an uptrend than in a downtrend. This is due to the fact that in an uptrend, the market is more dominated by bullish power and volume.
Rising lows in the ascending triangle pattern warn traders that the buying pressure is gradually increasing, and this, in turn, signals potential long entries in the market.
The breakout of the upper resistance gives a high probability of continued growth in the price, especially if the broken resistance line is successfully tested and the price bounces up.
Examples of Ascending Triangle Pattern
Let us consider an example of an ascending triangle pattern in the daily chart of Apple Inc. stocks.
Following a downtrend, a long-term bullish trend starts in the market. As you see, the price chart has drawn an ascending triangle characterized by a flat resistance level and a rising support line.
The bulls tried to overcome the resistance level framed by the bears several times, “squeezing” the price from the bottom up. This, in turn, gave the pattern a price springing effect, which subsequently allowed buyers to break through the ceiling and head higher.
After the impulse breakout of the resistance, the asset accumulated at the same level for a short time, that is, the bulls formed a new foothold for the next rally.
Next, the breakout price level was tested, and the market continued to grow rapidly.
The price movement along the pattern is determined by its height, that is, from the low point of the support level to the high point of the resistance level.
How to Identify Bullish Ascending Triangle Pattern
It is not difficult to detect an ascending triangle in the chart since the contour of a right-angled triangle located horizontally is visually clearly traced.
To reliably determine the ascending triangle formation, it is enough to identify the following characteristic features of the price chart pattern:
-
This is a bullish pattern, which is usually formed in an upward sloping trendline as a trend continuation pattern. However, the figure can also form at the low of a downtrend as a reversal pattern, which promises a quick change in trend to bullish;
-
The horizontal resistance line must be united by at least two points that are approximately at the same level. Between these two points, a correction low of the price should be formed;
-
The support level must be connected by at least two consecutive separated points. In addition, each subsequent minimum must be higher than the previous one. Otherwise, the pattern will not be true;
-
An ascending triangle pattern is more likely to work out in long timeframes, for example, weekly or monthly ones. However, one could use this formation in day trading or timeframes of several days;
-
Trading volumes tend to rise during the pattern formation. It is preferable when the volume rises at the moment of the resistance breakout, but it is not a necessary condition;
-
The pattern is confirmed by the breakdown of the upper horizontal line. At this moment, the broken resistance line is a new foothold for the bulls, that is, a new support level. Subsequently, corrective testing of the broken level may take place exactly to this mark;
-
The profit target of the ascending triangle pattern is determined by the height of the wide part of the formation.
Rising Triangle Pattern Measuring Technique
If all the criteria and characteristic features of the pattern are met, it is necessary to measure the potential profit target for the pattern before entering a buy trade.
To determine the likely price movement according to the pattern, you can use the usual tools built into the LiteFinance online trading terminal, namely the “Price Range.”
Having identified an ascending triangle in the price chart, it is necessary to draw it and stretch the “Price Range” tool from the beginning of the ascending lower trend line, that is, from the lowest point of the triangle pattern to the resistance line. After that, you need to duplicate the tool using the “Clone” function and apply it from the level of the resistance line breakout to the expected profit target.
It is illustrated in the H4 ETHUSD price chart below.
Ascending Triangle vs Descending Triangle
The main difference between the ascending and descending triangles is the price movement direction.
The Ascending Triangle is a bullish pattern. The support line for buyers is sloping upwards, while the resistance level is the upper horizontal line. At this time, the bulls push the price from bottom to top for a further price breakout of the resistance line.
A Descending Triangle is a falling bearish price pattern that is directed down.
The upper line in the descending triangle is directed downwards, while the lower line is horizontal. In this situation, the bears “squeeze” the price from top to bottom for a price breakout of the lower line.
Ascending Triangle vs Rising wedge
The ascending triangle pattern is very similar to the rising wedge pattern, which is why many traders, especially beginners, confuse them.
It is important to emphasize that the ascending triangle is a growth pattern, which usually means an uptrend continuation. Conversely, a rising wedge refers to reversal patterns. It appears at the high of an uptrend and means the price movement reversal downwards.
The difference between these two figures is that the triangle pattern has a horizontal upper trendline and an ascending trendline at the bottom, while the wedge forms as an ascending narrowing channel.
In the ascending triangle, the price breaks the horizontal line upwards, while in the rising wedge, there is an impulse breakout of the upper line downside.
Another important difference is trading volumes. With a rising wedge, trading and pattern formation occurs on increased volumes. In contrast, in the formation of an ascending triangle, volumes are minimal and can only increase when the upper resistance is broken.
Psychology of the Ascending Triangle
Any price action reflects the current psychological state of the market, or rather the psychology of traders.
In the case of an ascending triangle pattern, the bulls move the price up to the formed horizontal resistance. At this point, the selling pressure increases, and the price begins to turn around. However, buyers are determined to push the price up. Thus, the lower upward sloping trendline is rising, and each subsequent low is higher than the previous one. Bulls and bears are moving toward each other and meet at the resistance level.
As a rule, when the price approaches the upper line, volumes increase, and already here, it is determined who is stronger, bulls or bears.
The resistance breakout upside means the victory of the bulls. However, another situation may arise when the price target begins to decline intensively, breaking through all previous lows. This can only mean one thing: the bears have won this battle and intend to increase the selling pressure, driving the price down.
Selling pressure usually rises when negative news and data are released that directly relate to the traded asset.
How to Trade the Ascending Triangle
There are several methods to trade the ascending triangle in technical analysis. Let us look at some of them.
Method №1
Let’s consider the classic trading method in the formation of the ascending triangle pattern on the example of the EURUSD daily chart.
Below, you can see a bullish chart pattern. The asset price draws a long resistance line, from which the price bounced three times. However, the price lows gradually increase, forming a rising lower trendline as a strong support level. That is, the bulls confirmed their intention, and the price breaks through the resistance area.
On the fourth try, the bulls succeed, and the price breaks out the level from bottom to top. At this moment, one should enter a long trade. The stop loss is set a little lower within the triangle according to risk management rules.
The target profit is defined by the height of the triangle itself. Attach the Price Range tool to the chart and determine the level that the price should potentially reach. Draw a line and set a take profit.
Method №2
You can use a more conservative trading strategy to trade ascending triangle.
The essence of trading with this method is to expect a retest of the broken-out resistance level. Let’s take a closer look at the four-hour chart of Apple Inc. stock.
You can see from the chart below that bulls break out the resistance level, and the price is corrected down to test the broken-out level.
In this case, it is important to expect the retest of the level and, having made sure that the bulls consolidated the price above, enter a long.
A stop loss is set a little lower in the triangle. The reference could be the candlestick, from which the upward movement has started following the breakout. The potential price movement is defined by the maximum height of the triangle.
Method №3
Another profitable strategy to trade ascending triangles is to set a perpendicular line and build a symmetrical triangle.
Let us have a look at the four-hour BTCUSD chart.
The figure below shows the formation of an ascending triangle. In this case, as well as in others, it is important to wait for the breakout of the resistance level. After that, you can open a long position. At the same time, the stop loss should be set according to the rules of risk management a little lower in the triangle itself.
In order to determine the take profit level, it is necessary to set a perpendicular line opposite the rising support line from the beginning of the resistance and construct a symmetrical triangle.
In this case, you can determine the expected profit target level in the trade.
Advantages and Limitations of Using Ascending Triangle Pattern
Like other price patterns, the ascending triangles have their advantages and disadvantages.
Benefits:
-
the ascending triangle can be used when trading any financial instrument. The pattern can be found both in the stock market and in the Forex, the cryptocurrency market, and the commodity market;
-
an ascending triangle pattern can appear in any timeframe, both long-term and short-term. In addition, many traders use this pattern in day trading;
-
due to its ease of detecting and trading, the pattern can be used by beginners, as there are clear criteria for entering and exiting a trade;
-
you do not need any complicated indicators or additional tools to trade an ascending triangle pattern. It is enough to know the basic rules of pattern formation and its typical features.
Drawbacks:
-
the ascending triangle pattern does not always give correct and accurate signals, in particular, this applies to its formation in a downtrend. Due to decreasing trading volumes in a downtrend, bulls do not always have the strength to turn the price up. Thus, a bullish trap for buyers is formed in the chart, which gives the wrong signal to buy, forming false breakouts;
-
due to its structure, the triangle can take a long time to form on the chart before a good entry point according to the pattern appears. Therefore, when trading, it is better to use pending orders to buy, as there is a risk of missing a good entry point during an impulse upside breakout of the resistance level by the price;
-
there is a risk of confusing the ascending triangles pattern with the rising wedge, a bullish-to-bearish reversal pattern, because a perfect triangle rarely appears in the price chart.
Conclusion
Summing up, I would like to outline the following key takeaways:
-
The ascending triangle signals the price growth;
-
The pattern can be met in different timeframes and financial instruments;
-
The pattern can mean an uptrend continuation or a downtrend reversal upward;
-
The formation has clear features and rules to enter and exit trades, as well as set stop-losses and take-profits;
However, the pattern could indicate false breakouts, causing even experienced traders to lose money.
Therefore, before trading on a real account, you can test your skills and gain experience in trading without any risks on a free LiteFinance demo account. This account provides a wide range of financial instruments for risk-free real-time trading.
Ascending Triangle Trading FAQs
The content of this article reflects the author’s opinion and does not necessarily reflect the official position of LiteFinance. The material published on this page is provided for informational purposes only and should not be considered as the provision of investment advice for the purposes of Directive 2004/39/EC.