

Apple Inc,an American multinational technology company that specializes in the design, manufacture, and sale of smartphones (iPhone), personal computers (Mac), tablets (iPad), wearables and accessories (Apple Watch, AirPods, Apple Beats), TVs (Apple TV) and other varieties of related services (iCloud, digital content stores, streaming, licensing services), shall release its Q1 2023 earnings result on 2nd February (Thursday), after market close. What lies ahead for this conglomerate with the largest market capitalization at over $2.3T? Fig 1:Shares of Apples Revenue by Product Category – Source: Statista
Apple’s iPhone sales have accounted for most of the company’s total revenue for over the last few years In Q4 2022, the company reported $90.15B in revenue, up 8.1% on the year-ago period. iPhone revenue was $42.63B, up +9.67% (y/y); Services revenue was $19.19B, up +4.98% (y/y); Mac revenue was $11.51B, up +25.39% (y/y) while the iPad revenue was $7.17B, down -13.06%. Other products revenue was $9.65B, up +9.85% (y/y). For fiscal 2022, Apple’s final sales revenue was up 8% to $394.3B (CEO Tim Cook: “…would have grown to “double digits” if not for the FX headwinds”). Net profit was $20.7B (versus $20.5B (y/y)), or EPS $1.29 (versus $1.27 (y/y)).
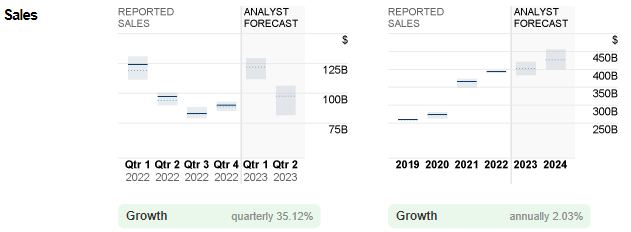 Fig 2:Reported Sales of Apple Inc versus Analyst Forecast: CNN Business
Consensus estimates for sales of Apple Inc in Q1 2023 stood at $121.8B, up over 35% from the previous quarter, but slightly down -1.72% from the same period last year. In the previous quarter, Apple’s MacBook (specifically the M2 Pro and M2 Max) delivered impressive sales results, thanks to the company’s new wholly owned high end processors technology that allowed its products to work way faster, which helped the company not only secure a competitive edge in the market, but at the same avoid third-party bottlenecks.
 Fig 3:Revenue Change for Desktop PCs, Laptops and Tablets (Worldwide). Source: Statista
The management expects Mac sales to decline substantially in the coming quarter following a globally slowing PC market, yet remains confident that this downturn could be quickly reversed. The data above has revealed a more than 4% decline in the revenue of desktop PCs, laptops and tablets last year. This year, it is projected that revenue of both desktop PCs and laptops could improve substantially by +1.7% and +1.6% respectively.
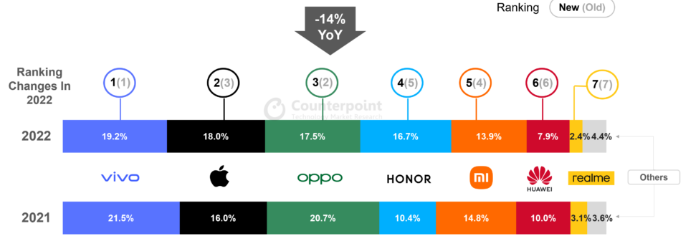
Fig 4:China Smartphone Sales Market Share. Source: Counterpoint
On the other hand, the latest statistic revealed that Apple’s iPhone ranked 2nd in the global market share, at 26.98% (just behind Samsung’s 27.38%). This shows a high penetration rate of iPhones in the market, but it should not be underestimated that Samsung could continue to lead the race in near term as it expands aggressively into new markets specially India and China. Last year, the iPhone became the #2 favourite smartphone brand in China for the first time ever in history (thanks to its latest iPhone 14 model), despite the country’s weakened consumer demand and cooling domestic economy. However, following China’s relaxed Covid policy and the subsequent operation of local production plant Foxconn recently, market participants expect that supply chain disruption could be further relieved, meanwhile there will be marginal recovery in the smartphone sales.

Fig 5:Reported EPS of Apple Inc versus Analyst Forecast. Source: CNN Business
EPS is expected to hit $1.94, up over 50% from the previous quarter, and slightly down -8.25% from the same period last year. In general, the forecast figure reflected analysts’ optimism.
Technical Analysis:

#Apple (AAPL.s) share price last closed below resistance zone $145-$147, retesting dynamic support 100-day SMA. If selling pressure persists, a break below the moving average could further bring the company’s share price down to the next support at $139. There is minor support at $134-$135, a low level seen in Oct/Nov last year, followed by June ’22 low at $129. On the other hand, if price breaks above the strong resistance $145-$147, there is possibility for the bulls to continue testing $153, an FR 50% extended from the lows in June ’22 to the highs in August ’22. A solid breakout above the level could mark a price escape from the bearish territory in the near term.
Click here to access our Economic Calendar
Larince Zhang
Market Analyst
Disclaimer: This material is provided as a general marketing communication for information purposes only and does not constitute an independent investment research. Nothing in this communication contains, or should be considered as containing, an investment advice or an investment recommendation or a solicitation for the purpose of buying or selling of any financial instrument. All information provided is gathered from reputable sources and any information containing an indication of past performance is not a guarantee or reliable indicator of future performance. Users acknowledge that any investment in Leveraged Products is characterized by a certain degree of uncertainty and that any investment of this nature involves a high level of risk for which the users are solely responsible and liable. We assume no liability for any loss arising from any investment made based on the information provided in this communication. This communication must not be reproduced or further distributed without our prior written permission.